. 2017 Nov 16;6:e29338. doi: 10.7554/eLife.29338

Figure 8. Atg9 interacts with TSC2 to regulate midgut cell growth.

(A) S2 cells transfected with pWA-Gal4, pUAS-Flag-TSC2 and pUAS-GFP-Atg9 were subjected to immunoprecipitation with anti-Flag or anti-GFP antibody. The immunoprecipitates and total cell lysates were analyzed by Western blot with antibodies as indicated. (B) Clonal expression of Atg9RNAi (marked in Red) in the adult midgut resulted in marked decrease in TSC2 levels (green). Line scan across the Atg9RNAi clone to show the relative fluorescent intensities of TSC2 in control (dsRed-negative) and Atg9 depletion (dsRed-positive) cells. Scale bar: 5 μm. (C) The adult midguts of denoted genotypes were dissected, lysed, and subjected to Western blot analysis with anti-Atg9, anti-TSC2 and anti-tubulin antibodies. N = 3, data are mean ±s.e.m. *p<0.05. (D) Model for the antagonistic effect of Atg9 on TOR signaling in the regulation of intestinal cell growth and midgut homeostasis in Drosophila. Genotypes: (G) hsflp; UAS-Atg9RNAi/+; Act-CD2-Gal4-UAS-dsRed..

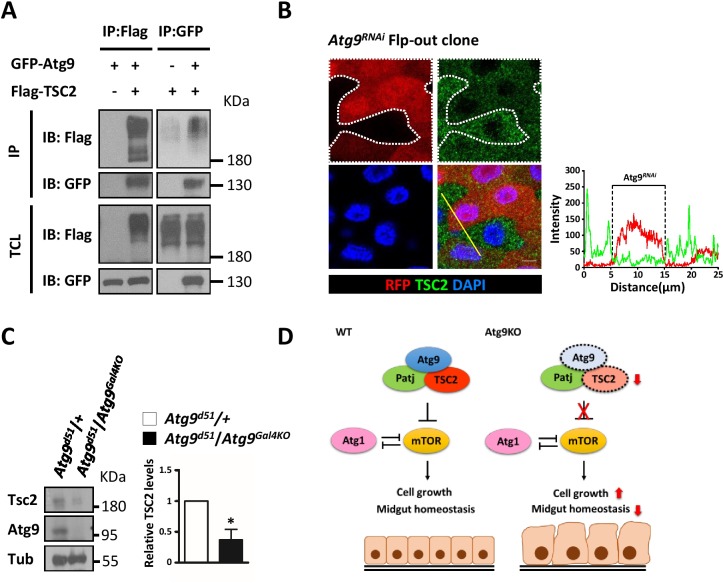
Figure 8—source data 1. Quantification of fluorescent intensity and Western blots.
DOI: 10.7554/eLife.29338.034

Figure 8.

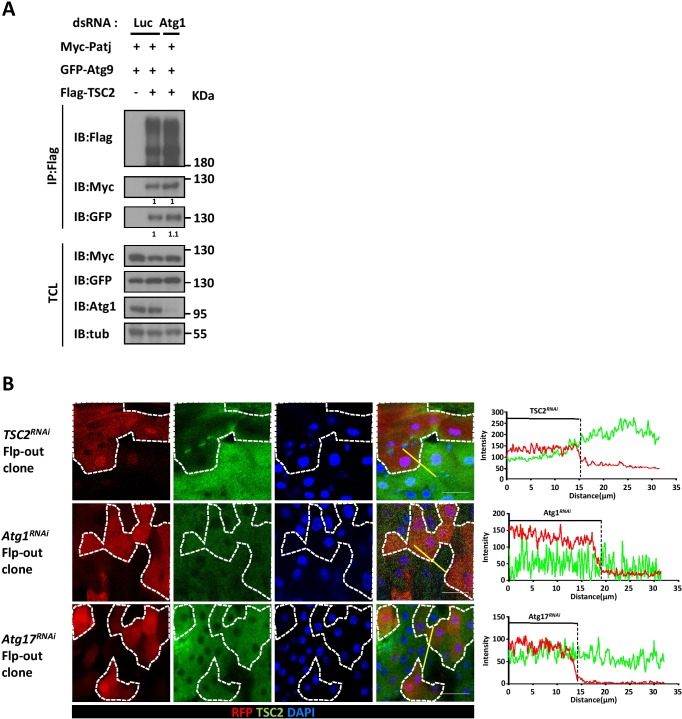
Figure 8—figure supplement 1. Atg9 interacts with Patj and TSC2 independent of Atg1.

Figure 8—figure supplement 1.

(A) S2 cells treated with dsRNAs targeting luciferase (Luc) or Atg1 were transfected with pWA-Gal4, pUAS-GFP-Atg9, pUAS-Myc-Patj, and pUAS-Flag-TSC2 and subjected to immunoprecipitation with anti-Flag antibody. The immunoprecipitates and total cell lysates were analyzed by Western blot with antibodies as indicated. (B) Clonal analysis showed that TSC2 levels were not affect in Atg1 and Atg17 knockdown cells. Line scan across the TSC2RNAi, Atg1RNAi and Atg17RNAi clones to show the relative fluorescent intensities of TSC2 in control (dsRed-negative) and RNAi-knockdown (dsRed-positive) cells. Scale bar: 5 μm. Genotypes: (B) hsflp; UAS-TSC2RNAi/+; Act-CD2-Gal4-UAS-dsRed, hsflp; UAS-Atg1RNAi/+; Act-CD2-Gal4-UAS-dsRed, and hsflp; UAS-Atg17RNAi/+; Act-CD2-Gal4-UAS-dsRed..
Figure 8—figure supplement 1—source data 1. Quantification of fluorescent intensity.
DOI: 10.7554/eLife.29338.035