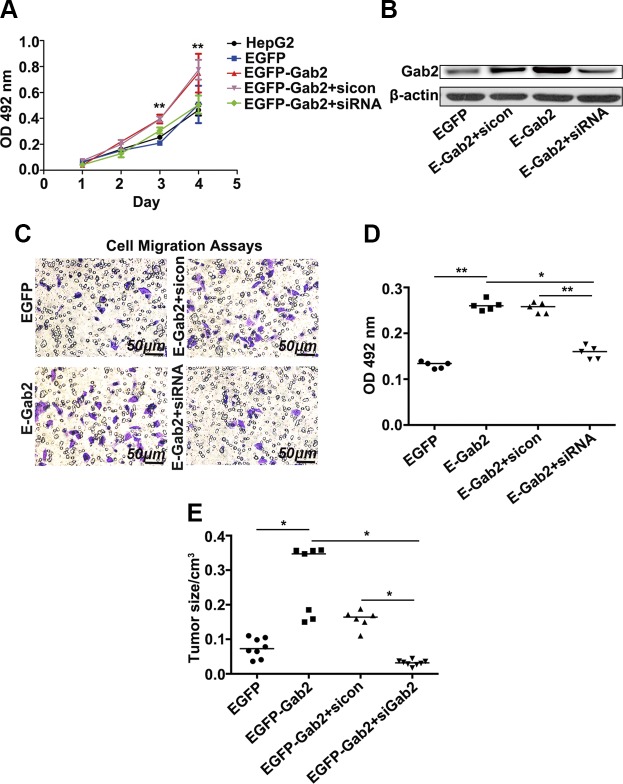
Figure 3.
Overexpression of Gab2 increases the tumorigenic activity of HepG2 cells. A) Cell growth curves were measured by using MTT assays. B) Gab2 protein expression levels in 4 cell lines were determined by Western blotting. C, D) Representative images of migratory cells in transwell assays after crystal violet staining (C, blue color) and quantitative analysis of migratory cells on the basis of staining (D). E) Statistical analysis of tumor size in nude mice that were injected with HepG2 cells that expressed Gab2. SiCon [control small interfering RNA (siRNA)] or Gab2 siRNA (siRNA). OD, optical density. *P < 0.05, **P < 0.01.

