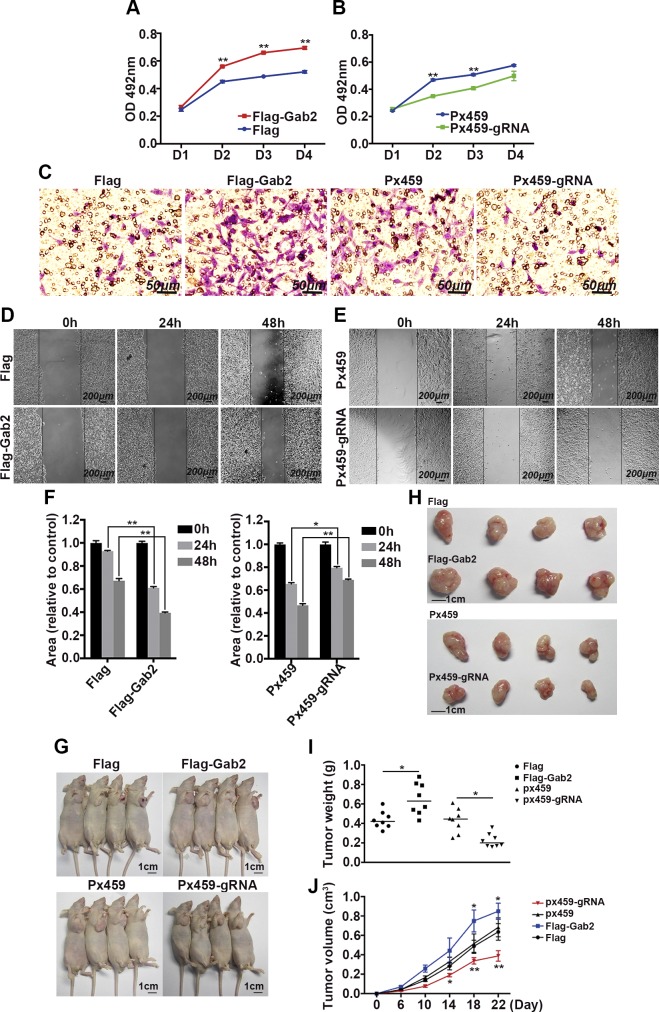
Figure 4.
Deletion of Gab2 impairs the tumorigenic activity of HepG2 cells. A, B) MTT assay for growth of cells with different Gab2 protein levels. C) Migration of 4 groups of cell lines in a transwell assay with crystal violet staining. D–F) Representative images (D, E) and quantitative analysis (F) of the wound healing assay with cells with different Gab2 protein levels. G) Representative nude mice that were injected with different cell lines. H) Representative tumors from nude mice that were injected with different cell lines. I) Tumor weights of the 4 groups of mouse models. J) Average tumor growth curves in nude mice. n = 8 mice per group. Flag, control for Gab2-overexpressing cells; Flag-Gab2, Gab2-overexpressing cells; Px459, control for Gab2-KO cells; Px459-gRNA, Gab2-KO cells. *P < 0.05, **P < 0.01.

