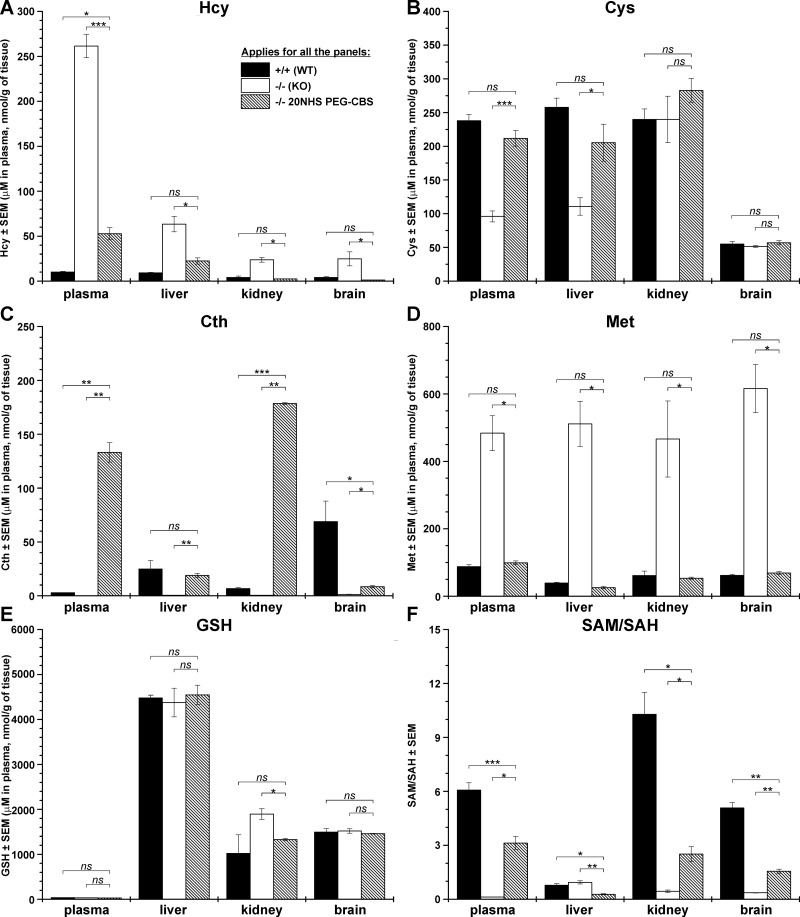
Figure 3.
Plasma and tissue levels of sulfur metabolites in untreated or 20NHS PEG-CBS–injected KO mice compared with untreated WT mice. The following metabolites are displayed in individual panels: Hcy (A), Cys (B), Cth (C), Met (D), GSH (E), and the methylation index (SAM/SAH ratio) (F). Total Hcy and Cys were determined in plasma, whereas the non–protein-bound fraction of these thiols was measured in tissue homogenates. Treated KO mice were dosed 3 times a week (7.5 mg/kg) from d 2 of age. Each group consisted of 3–4 18-d-old mice. *P < 0.05, **P < 0.01, ***P < 0.001.

