Figure 4.
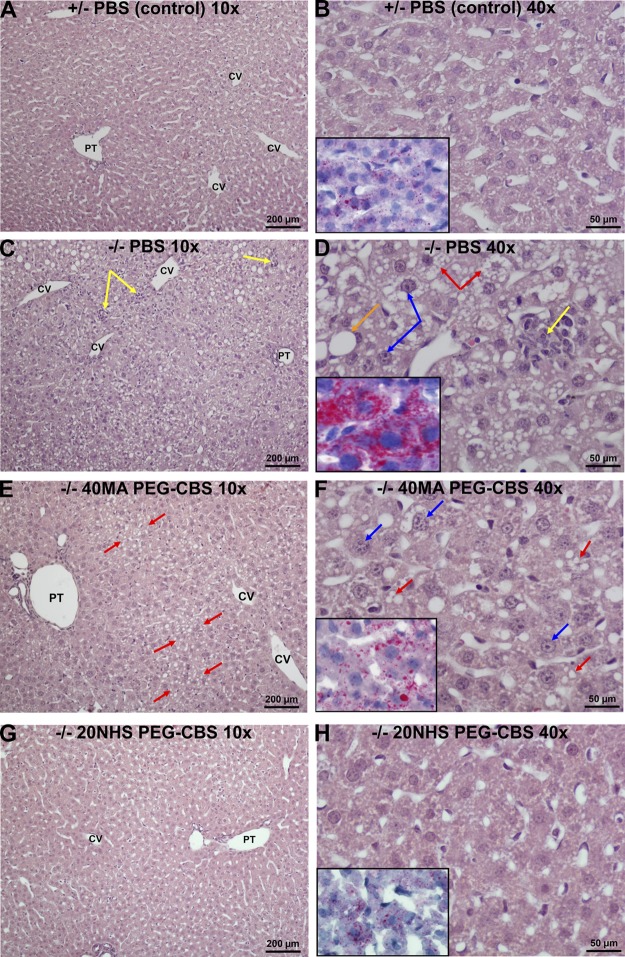
Effect of PEG-CBS treatment on liver histopathology of KO mice at the light microscopy level. PBS-injected healthy heterozygous mice (A, B) served as controls. Liver findings in PBS-injected KO mice (C, D) were compared with the ones from 40MA (E, F) and 20NHS (G, H) PEG-CBS–treated KO mice (SC, 3×/wk, 7.5 mg/kg). The left panels (A, C, E, G) show low-magnification views (original magnification, ×10; scale bars, 200 µm). The right panels (B, D, F, H) display higher magnification views (original magnification, ×40; scale bars, 50 µm) of hematoxylin and eosin–stained liver parenchyma. Insets in the right panels illustrate Oil Red O–specific stain for apolar lipids in the cytoplasm of hepatocytes. Yellow arrows point to focal hepatocellular necroses with resorptive inflammatory reaction. Orange and red arrows designate micro- and macro-vesicular steatosis, respectively. Blue arrows denote enlarged hyperchromatic nuclei and prominent nucleoli. CV, central vein; PT, portal tract.

