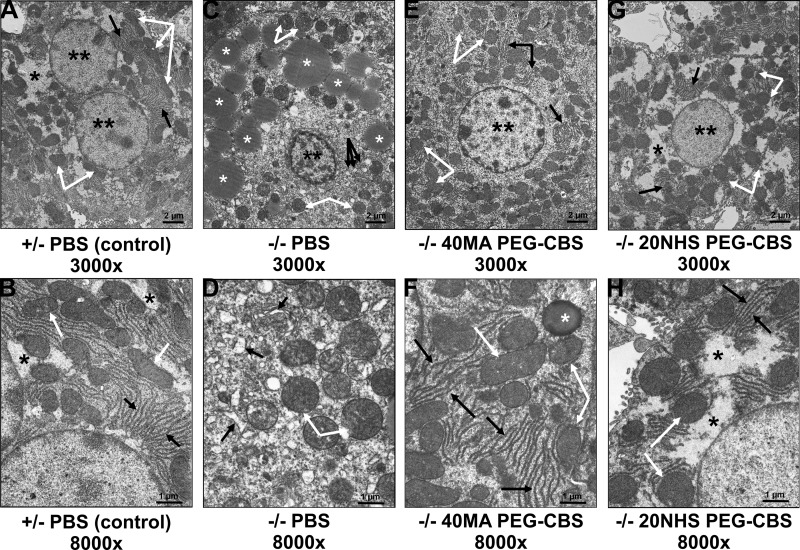
Figure 5.
Effect of PEG-CBS treatment on liver histopathology of KO mice at the electron microscopic level. PBS-injected healthy heterozygous mice (A, B) served as controls. Ultrastructure of hepatocytes in PBS-injected KO mice (C, D) was compared with the ones from 40MA (E, F) and 20NHS (G, H) PEG-CBS–treated KO mice (SC, 3×/wk, 7.5 mg/kg). Top panels (A, C, E, G) show low-magnification views (original magnification, ×3000; scale bars, 2 µm). Bottom panels (B, D, F, H) display higher magnification views (original magnification, ×8000; scale bars, 1 µm). Double black asterisks designate nuclei; single black asterisks denote cytosolic glycogen. White asterisks indicate lipid droplets. White arrows point to mitochondria (swollen in C and D). Black arrows direct to rough endoplasmic reticulum in all panels except C, where black arrows designate numerous cytoplasmic cisternae and vesicles seen at lower magnification.

