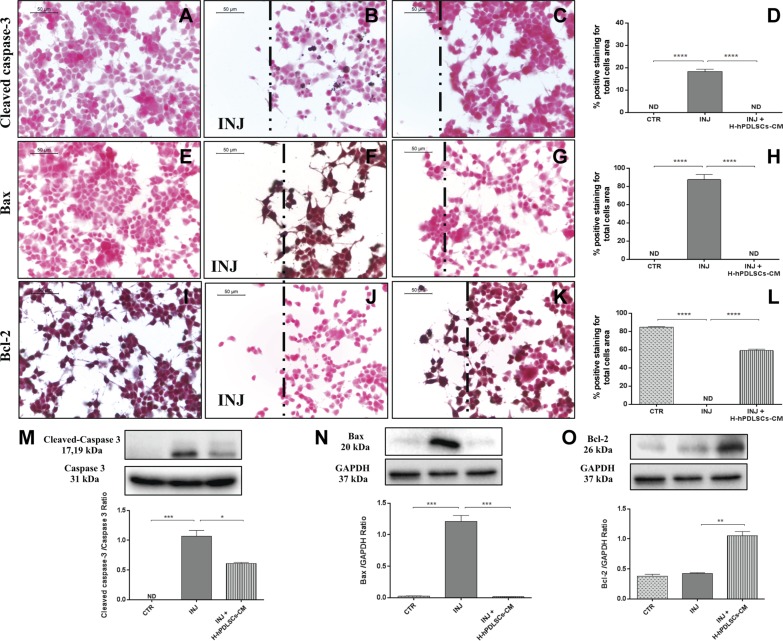
Figure 10.
A–C) Immunohistochemistry analysis for cleaved caspase-3 in control (CTR) cells (A), scratch-injured (INJ) neurons (B), and H-hPDLSCs-CM–treated scratch-injured neurons (C). D) Densitometric analysis for cleaved caspase-3. E–G) Immunohistochemistry analysis for Bax in CTR cells (E), scratch-injured neurons (F), and H-hPDLSCs-CM–treated scratch-injured neurons (G). H) Densitometric analysis for Bax. I–K) Immunohistochemistry analysis for Bcl-2 CTR cells (I), scratch-injured neurons (J), and H-hPDLSCs-CM–treated scratch-injured neurons (K). L) Densitometric analysis for Bcl-2. Black dotted lines indicate the area of scratch injury. M) Western blot analysis for cleaved caspase-3. CTR vs. INJ; INJ vs. INJ + H-hPDLSCs-CM, *P = 0.0121. N) Western blot analysis for Bax. ****P < 0.0001, CTR vs. INJ and INJ vs. INJ + H-hPDLSCs-CM. O) Western blot analysis for Bcl-2. INJ vs. INJ + H-hPDLSCs-CM. **P = 0.0024. ND, not detectable.

