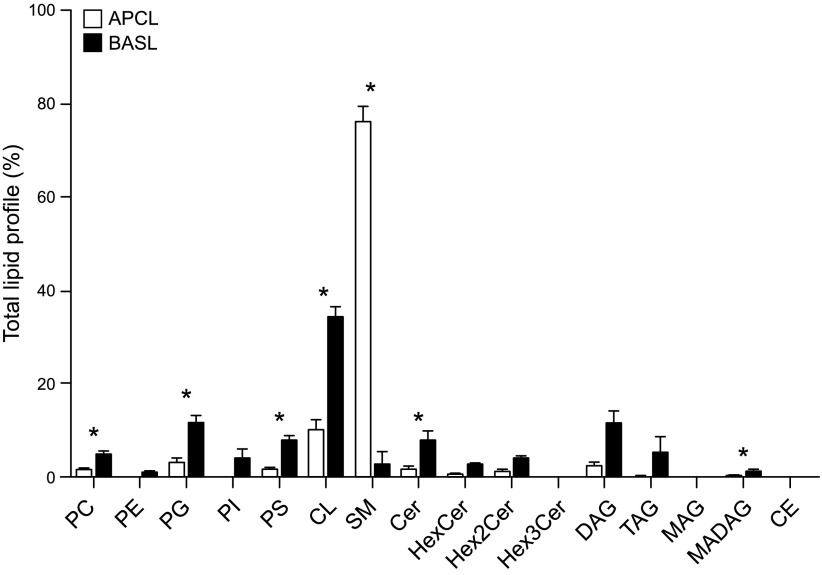
Figure 5.
Lipid profile analysis of exosomes in positive scan mode. Values are means of 3 replicates ± sem. Data were corrected for the amount of internal standards spiked into the samples and then normalized to total lipid. HexCer, hexosyl ceremide; TAG, triacylglycerol; DAG, diacylglycerol; MAG, monoacylglycerol; CE, cholesterol ester. *P ≤ 0.05 (FA abundances that are significantly different between the samples).

