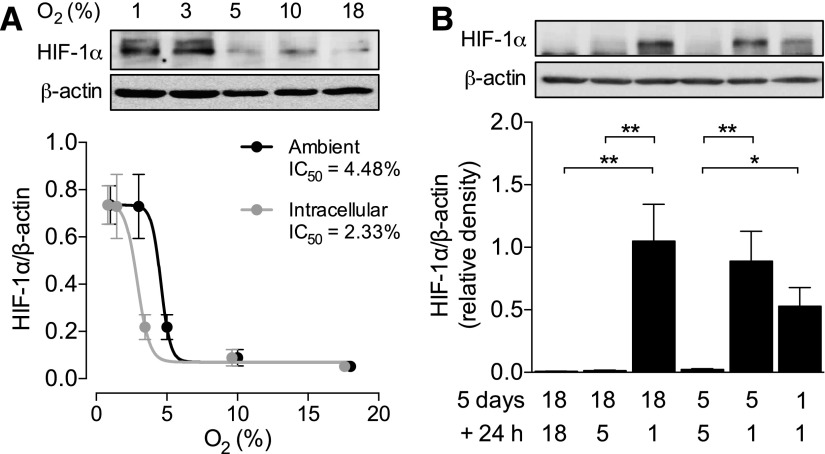
Figure 1.
HIF-1α stabilization in HUVECs at various oxygen levels. A) HUVECs were cultured in 18, 10, 5, 3, or 1% O2 for at least 5 d, and lysates were immunoblotted for expression of HIF-1α. Means ± sem (n = 4) were plotted against either the ambient or intracellular O2 level [as determined previously (4)], and a sigmoidal curve was fitted for determination of the IC50. B) HUVECs cultured in 18, 5, or 1% O2 for 5 d were then cultured for a further 24 h in either the same or lower O2 levels, and expression of HIF-1α was determined as before. Representative immunoblots are provided above and densitometric analysis of HIF-1α expression relative to the loading control β-actin below. Data are means ± sem (n = 4–5 different donors). *P < 0.05, **P < 0.01.

