Figure 2.
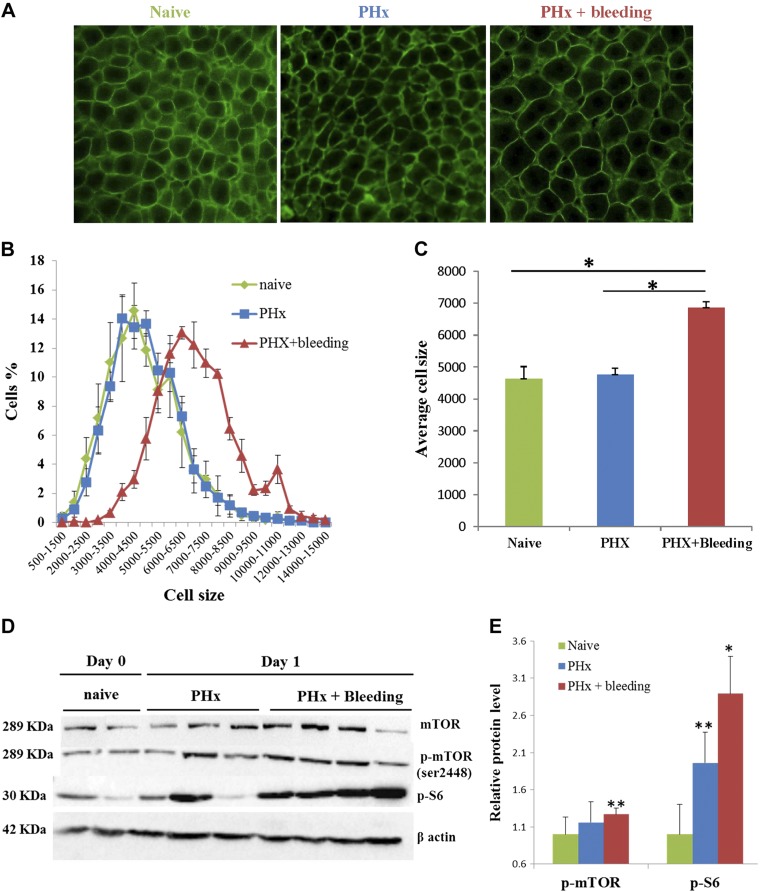
Bleeding generates hyperplastic to hypertrophic switch in regenerative response after PHx. A) Representative microphotographs of β-catenin (green) immunofluorescence staining of liver sections from rats before (left) and on POD 1 after PHx for PHx only (middle) or PHx and bleeding (right). B) Cell size distribution before (naive, green) and on POD 1 after PHx in livers of PHx only (blue) or PHx and bleeding (red) rats (n = 5 rats/group). C) Mean cell size of hepatocytes in the distribution shown in B. D) Western blot analysis of mTOR, phosphorylated mTOR, and phosphorylated S6 in livers from naive rats and rats humanely killed on POD 1 after PHx. E) Western blot quantification. Data are mean ± sem fold change vs. naive for same blot (n = 5). **P < 0.05 vs. naive.

