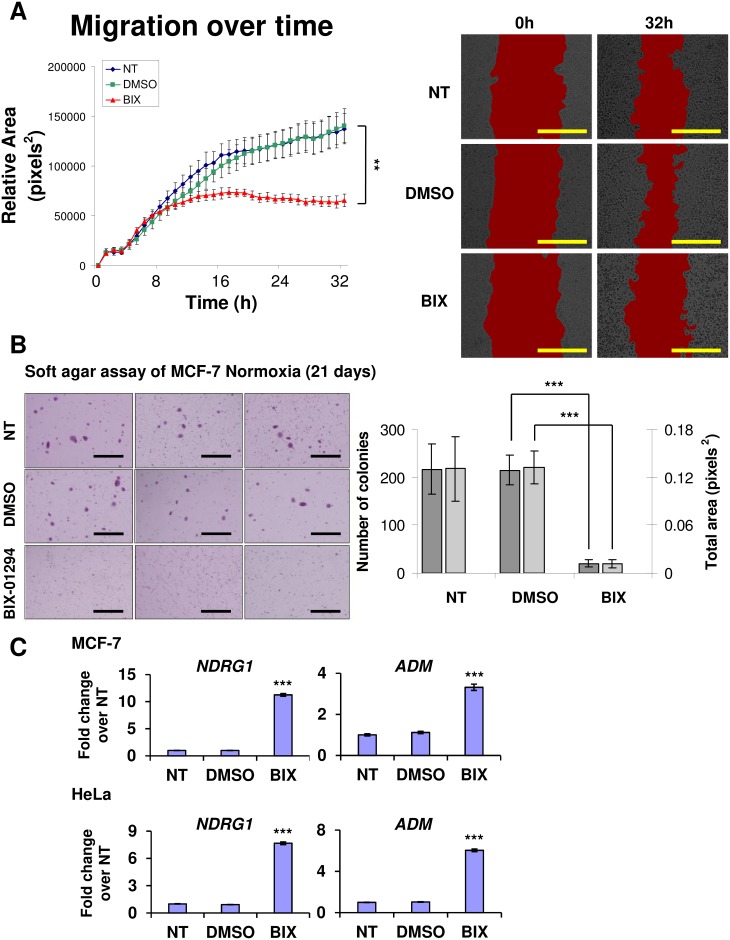
Fig 3. G9A inhibition leads to blockade of cell migration and loss of colony forming potential.
(A) Graph showing migration area covered by MCF-7 cells treated with 6 μM BIX-01294 (BIX, red line) at hourly intervals over 32 hours in scratch wound healing assays compared to the controls (NT, blue line; DMSO, green line). Error bars indicate SEM for n = 3 replicates. Areas measured are demarcated in red in the representative micrographs at the start (0h) and end (32h) of the experiment respectively for each condition. Scale bars represent 500 μm. (B) Micrographs showing MCF-7 colony formation under the indicated conditions in soft agar assays. Micrographs shown are the most representative of the averages of n = 3 replicates. Scale bars denote 1 mm. Bar chart indicates the number of colonies (dark grey) and the total area of the colonies (light grey) formed from the MCF-7 cells in each respective treatment. Error bars indicate SEM for n = 3 replicates. (C) Fold change in gene expression of NDRG1 and ADM in MCF-7 and HeLa cells treated with 6 μM BIX-01294 (BIX) compared to the NT and DMSO controls. Gene expression levels were normalized against the housekeeping reference gene EEF1G and fold change was calculated against the average of the NT controls. Error bars indicate SEM for n = 6 replicates.

