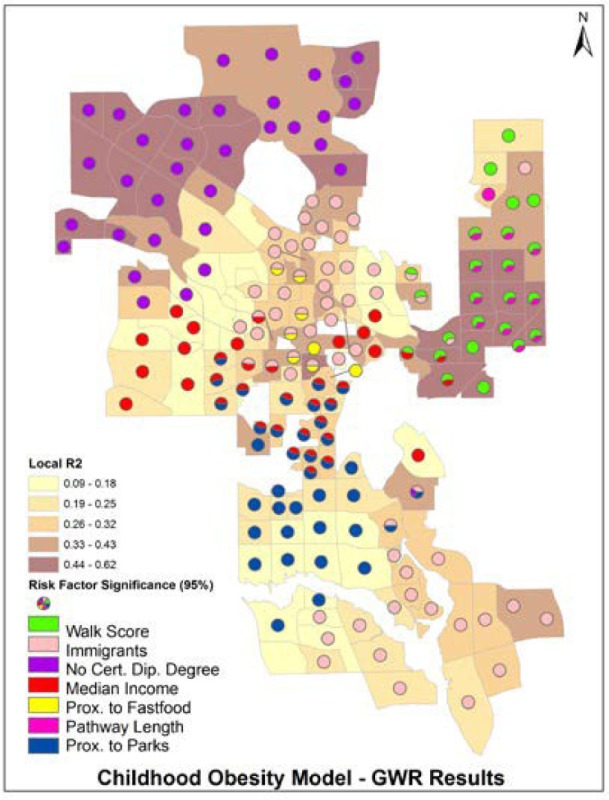
Table 2. Geographically weighted regression of child obesity prevalence.
| Regression Summary |  |
|||||||
| Regressions | 174 | Local Sample | 50 | |||||
| Mean Local R2 | 0.30 | |||||||
| Local R2 Min. | 0.09 | Local R2 Max. | 0.62 | |||||
| Coefficients | Min | Max | Mean | Range | ||||
| Education | -0.31 | 0.39 | 0.06 | 0.70 | ||||
| Immigrants | 0.00 | 0.34 | 0.08 | 0.34 | ||||
| Family income | -1.04 | 0.27 | -0.12 | 1.31 | ||||
| Prox. Fast food | -0.03 | 0.04 | 0.00 | 0.07 | ||||
| Prox. parks | -0.09 | 0.04 | -0.02 | 0.13 | ||||
| Walkscore | -1.59 | 0.77 | -0.05 | 2.36 | ||||
| Pathway length | -4.98 | 2.92 | -1.26 | 7.90 | ||||
| Obese Children | ||||||||
| Total | 3,626 | Percent | 9.7 | |||||
| Average | 21 | St. Dev | 23.4 | |||||
