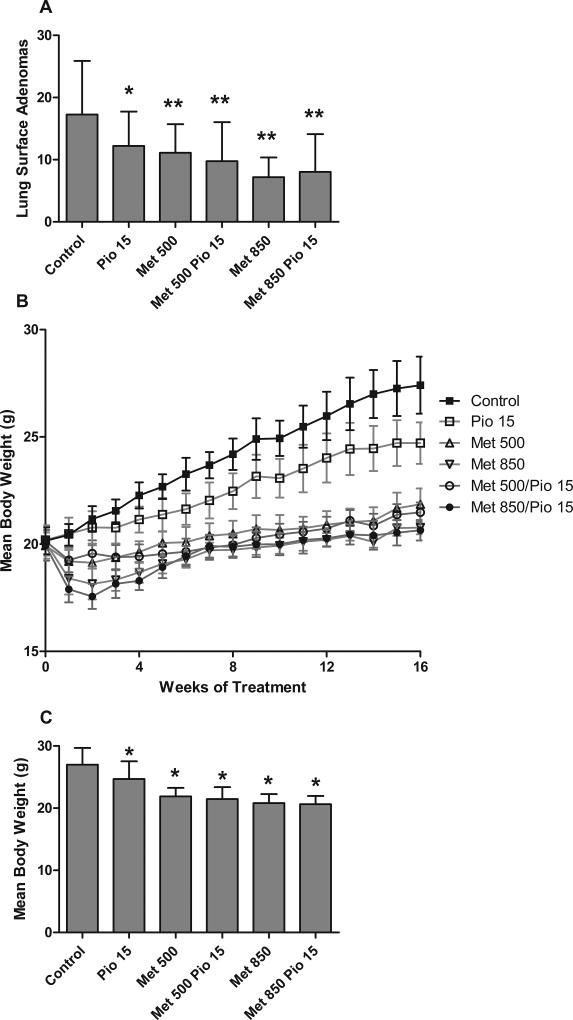
Figure 2.
Determination of dosing for pioglitazone and metformin. (A) By one-way ANOVA analysis, a statistically significant difference in adenoma formation in all treatment groups versus the control group was observed (F(5,171)=11.06,p<0.0001). (t-test versus control: * = p <0.01, ** = p <0.001) (B) Body weights over the duration of the dose finding study. (C) Endpoint body weights were significantly different by one-way ANOVA analysis (F(5,171=46.35,p<0.0001) and lower in treated groups versus the control group by Dunnett’s post testing (* = p <0.05).

