Figure 2.

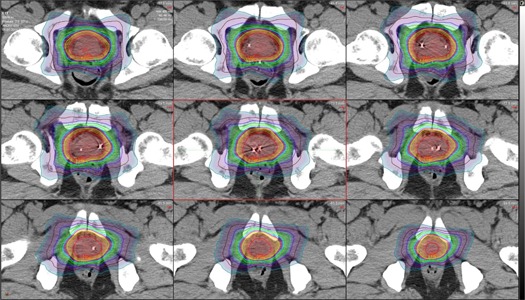
Axial view of the prostate with isodose lines for one fraction of the SBRT treatment. Each isodose line represents a change of 50 cGy. Slices moving superior to inferior from top left to bottom right.

Axial view of the prostate with isodose lines for one fraction of the SBRT treatment. Each isodose line represents a change of 50 cGy. Slices moving superior to inferior from top left to bottom right.