
Figure 5.
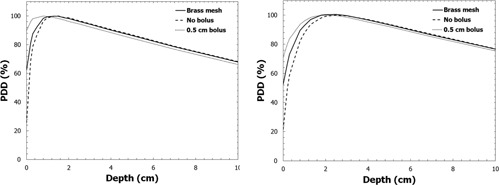
PDD curves for 6 MV (left) and 15 MV (right) beams measured with the Advanced Markus ionization chamber for the cases of 0.5 cm of tissue‐equivalent bolus, brass bolus, and no bolus.
Official websites use .gov
A
.gov website belongs to an official
government organization in the United States.
Secure .gov websites use HTTPS
A lock (
) or https:// means you've safely
connected to the .gov website. Share sensitive
information only on official, secure websites.
PDD curves for 6 MV (left) and 15 MV (right) beams measured with the Advanced Markus ionization chamber for the cases of 0.5 cm of tissue‐equivalent bolus, brass bolus, and no bolus.