
Figure 6.
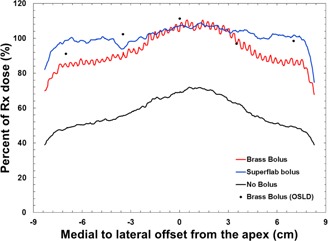
Surface dose profiles from medial (negative) to lateral (positive), using 6 MV tangential beams. Solid lines were measured with Gafchromic EBT3 film and the black dots were measured with OSLDs.
Official websites use .gov
A
.gov website belongs to an official
government organization in the United States.
Secure .gov websites use HTTPS
A lock (
) or https:// means you've safely
connected to the .gov website. Share sensitive
information only on official, secure websites.
Surface dose profiles from medial (negative) to lateral (positive), using 6 MV tangential beams. Solid lines were measured with Gafchromic EBT3 film and the black dots were measured with OSLDs.