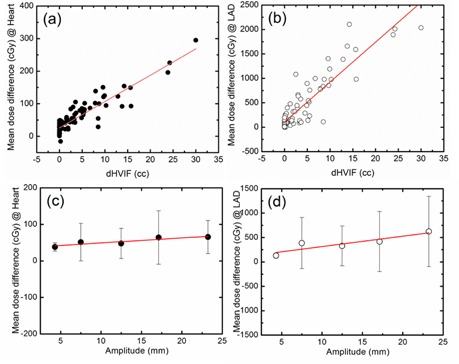
Figure 3.

Correlation of the mean dose reduction to dHVIF: (a) mean dose to heart, (b) mean dose to LAD artery with dHVIF are presented. Correlation of the mean dose reduction to mean DIBH amplitude with 5 mm bin size. (c) Mean dose to heart, (d) mean dose to LAD artery with sternal excursion are presented. The red solid line is the linear fit to the measured data (: ). It is noted that the linear fit to the measured data with are (fitting lines not included in the figure).
