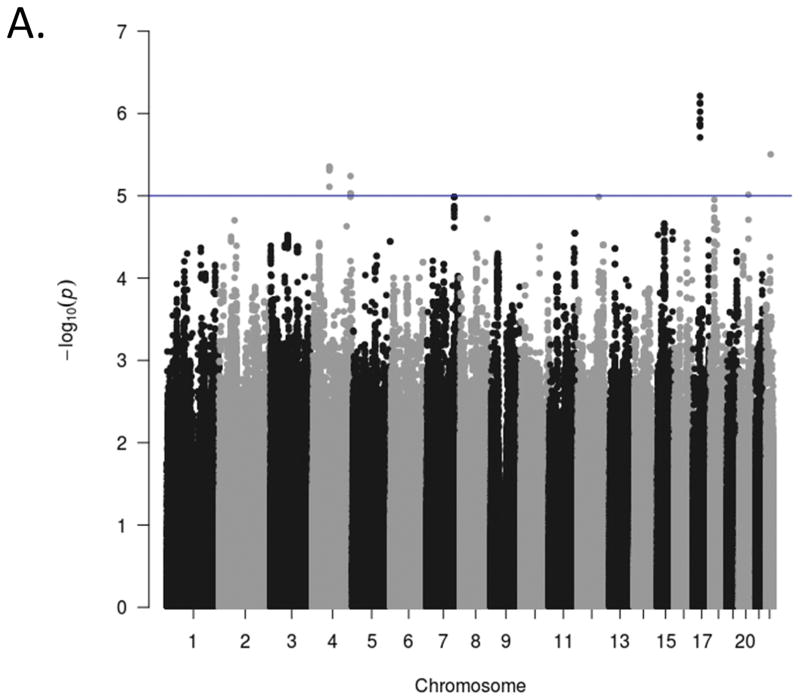
Figure 1.
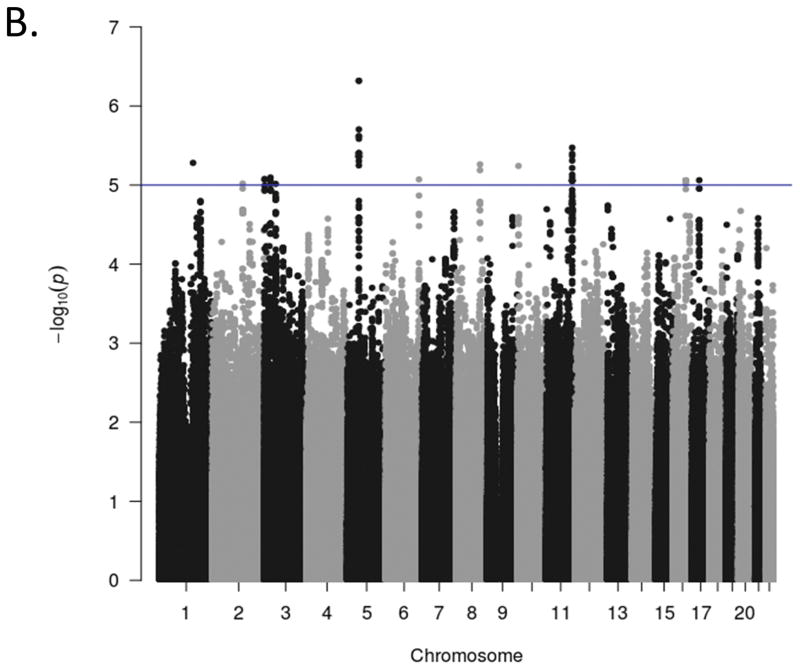
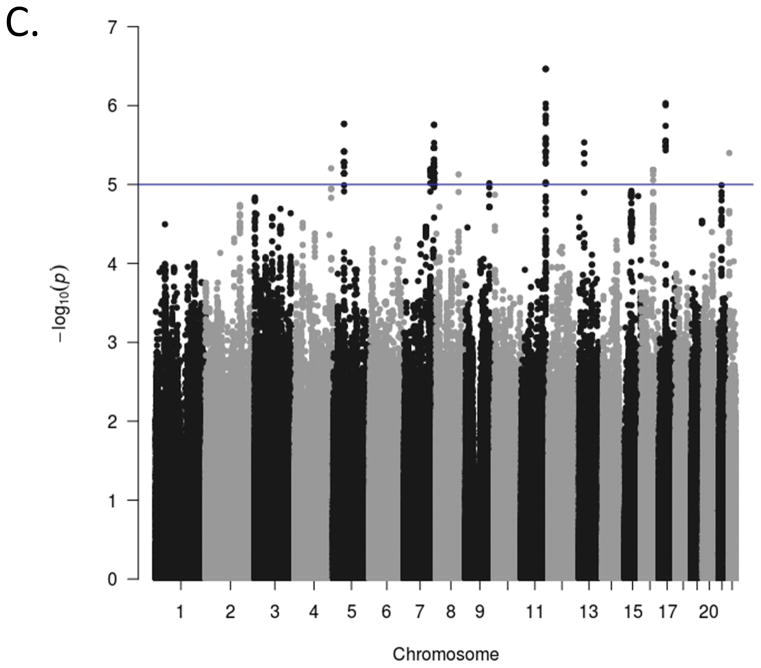
Genome-wide association Manhattan plots. The Manhattan plots display level of significance for each SNP, organized by chromosomal position from chromosomes 1–22. Panel A presents ADHD inattention, Panel B presents ADHD hyperactivity-impulsivity, and Panel C presents ADHD total score The blue line indicates suggestive significance (p<10−5). No SNPs achieved genome-wide significance (p<5x10⁻⁸).
Figure 1(b). Genome-wide association Manhattan plots. The Manhattan plots display level of significance for each SNP, organized by chromosomal position from chromosomes 1–22. Panel A presents ADHD inattention, Panel B presents ADHD hyperactivity-impulsivity, and Panel C presents ADHD total score The blue line indicates suggestive significance (p<10−5). No SNPs achieved genome-wide significance (p<5x10⁻⁸).
Figure 1(c). Genome-wide association Manhattan plots. The Manhattan plots display level of significance for each SNP, organized by chromosomal position from chromosomes 1–22. Panel A presents ADHD inattention, Panel B presents ADHD hyperactivity-impulsivity, and Panel C presents ADHD total score The blue line indicates suggestive significance (p<10−5). No SNPs achieved genome-wide significance (p<5x10⁻⁸).


