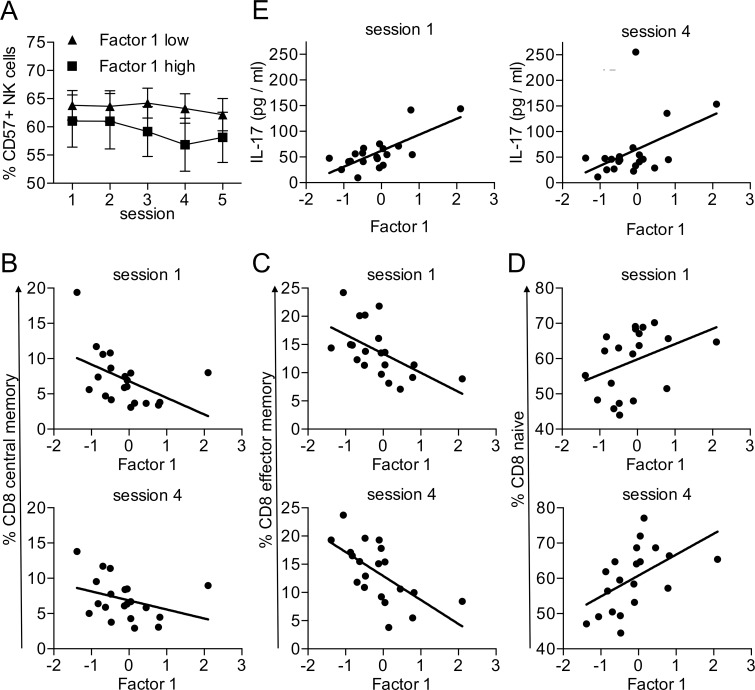
Fig 5. Association of maturation markers and inflammatory cytokines with chronic stress.
(A) Participants were divided at the median score of Factor 1 into high and low Factor 1 groups. Data are presented as mean ± sem of 20 individual participants. Data were analyzed by 2x5 ANOVA with Factor 1 as between-participants factor and the five-level within-participants factor representing Session. CD8+ T cell subpopulations were identified as described in Fig 3. Percentage of central memory (B), effector memory (C) and naive (D) CD8 T cells at sessions 1 and 4 was associated with Factor 1. Data were analyzed by correlation analyses. Data from 20 participants are shown. (E) Serum concentration of IL-17 at sessions 1 and 4 was associated with Factor 1. Data were analyzed by correlation analyses.

