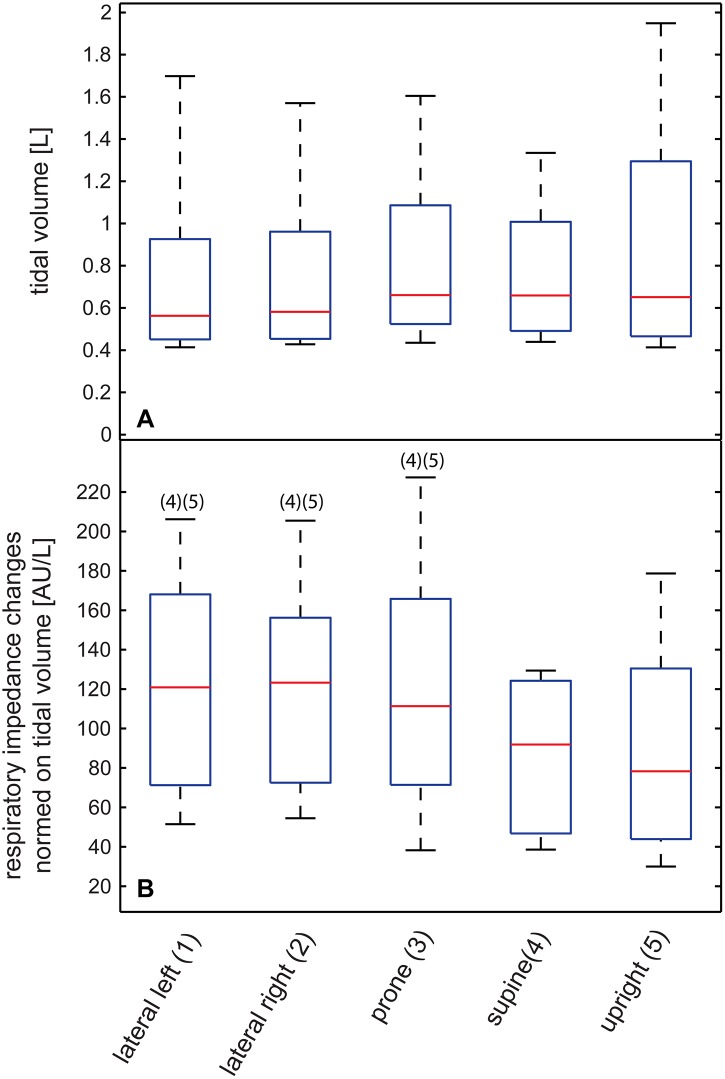
Fig 4. Tidal volumes and respiratory related impedance changes.
A) Tidal volumes in liters. B) Amplitude changes due to respiration were normalized to tidal volume [AU/L]. The example shows data reconstructed using RG. The red lines denote median values, the blue box encompasses values between the 25th and 75th percentile. Whiskers cover 95% of the data. Positions that are significantly different (Friedman’s test) are labeled with their appropriate number.

