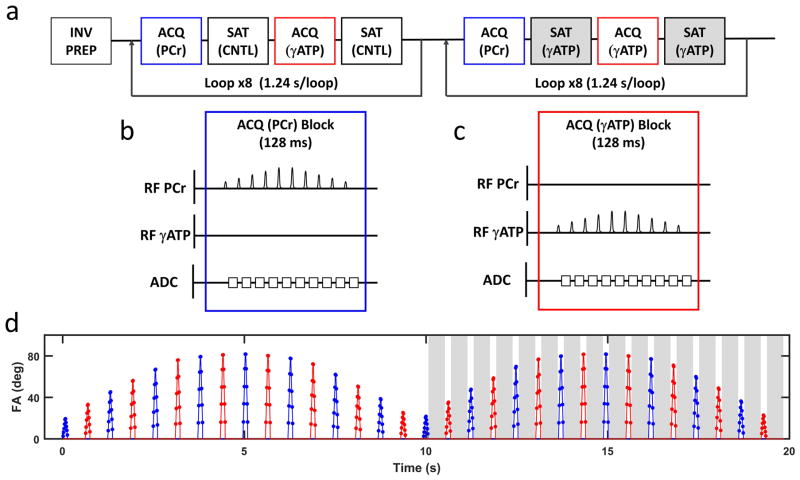
Figure 1. Sequence design.
a. Schematic of the CK-MRF pulse sequence. ACQ (PCr) and ACQ (γATP) are acquisition blocks for PCr and γATP, respectively. SAT (CNTL) and SAT (γATP) are contralateral and γATP saturation blocks, respectively. ACQ (PCr) and ACQ (γATP) used Gaussian excitation pulses, while SAT (CNTL) and SAT (γATP) used continuous wave RF pulses. b and c. Pulse sequence diagrams for one block of ACQ (PCr) (b) and ACQ (γATP) (c). d. Timing and nominal flip angles of all excitation pulses. Blue and red colors indicate PCr and γATP excitation, respectively. Grey shaded areas indicate γATP saturation.

