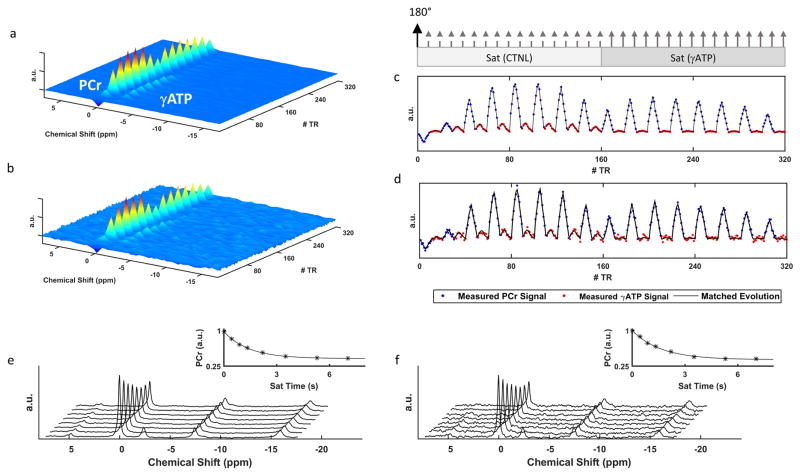
Figure 4. Representative in vivo CK-MRF spectra and fingerprints.
a and b. 31P spectra with 96 (a) and single (b) signal average(s). c and d. The corresponding fingerprints and their dictionary matches from 96 (c) and single (d) signal average(s). Blue and red data points represent PCr and γATP peaks, respectively. Relative timings for inversion and saturation pulses are indicated at the top. Dashed and solid arrows indicate contralateral and γATP saturation pulses, respectively. e and f. 31P spectra from 12 (e) and single (f) signal average(s) by MT-MRS. Results of the corresponding curve fitting to PCr signal are shown in the insets.

