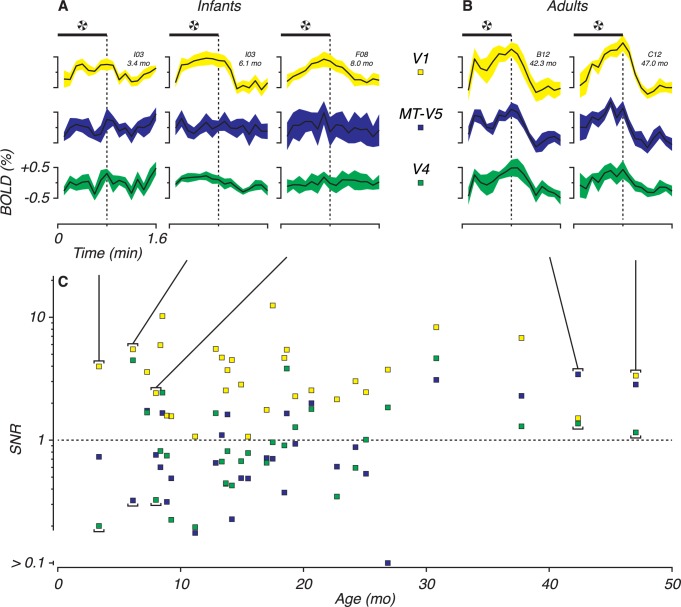
Fig 3. Response to pinwheel stimuli.
Voxels in areas V1 (yellow), MT-V5 (blue) and V4 (green). (A,B) Average BOLD for five representative sessions, three from infants (left, panel A) and two from adult (right, panel B). Solid black lines are average BOLD activation to pinwheel on-off alternations (8–12 repetitions). colored areas are standard deviations. The horizontal black bars indicate the time of stimulus presentation. (C) Signal divided by noise (Signal to noise ratio, SNR) as function of age. Signal is the amplitude at the frequency of the stimulus alternation (FF). The noise is the average of the amplitudes of the flanking, not stimulus related frequencies (0.5 FF and 1.5 FF). The signal exceeds noise when SNR > 1 indicated with a dashed line.

