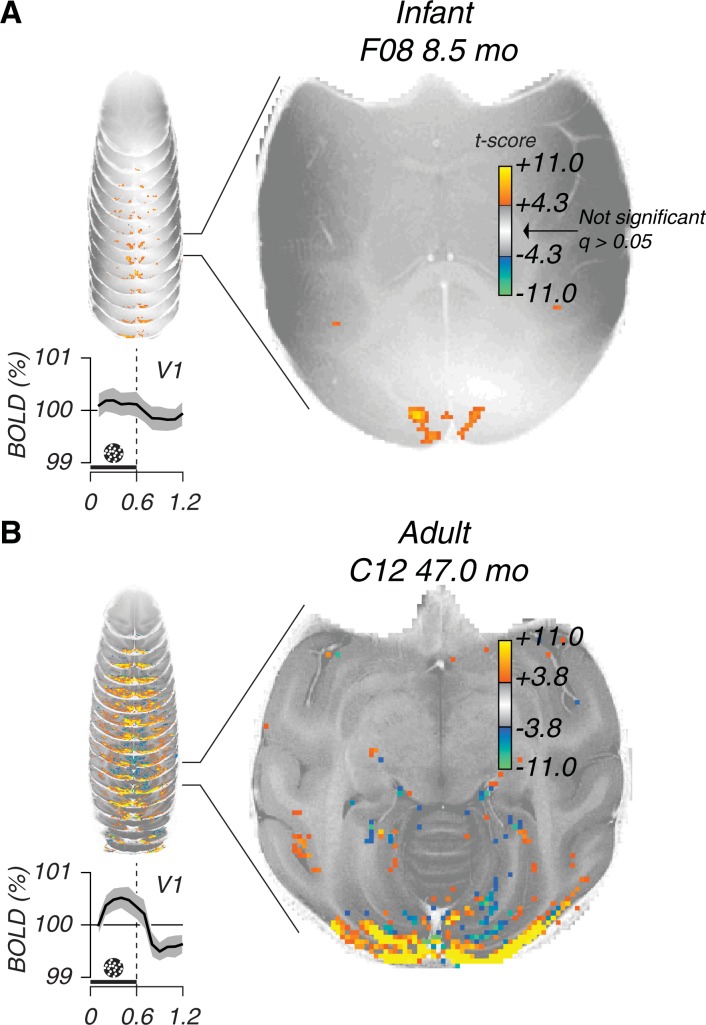
Fig 4. Two examples of generalized linear model maps.
(A) a session from a young subject and (B) a session from an older subject. The stacked images on the left are anatomical slices with GLM maps superimposed. One slice is exemplified next to the stack of slices. The GLM color maps are T-values (t-test) thresholded at a significance value that is corrected for false discovery rate (FDR, q < 0.05, see Methods). Traces below the stacked images are average BOLD response to Glass patterns in V1. Layout is similar as Fig 3 where pinwheel responses are shown.

