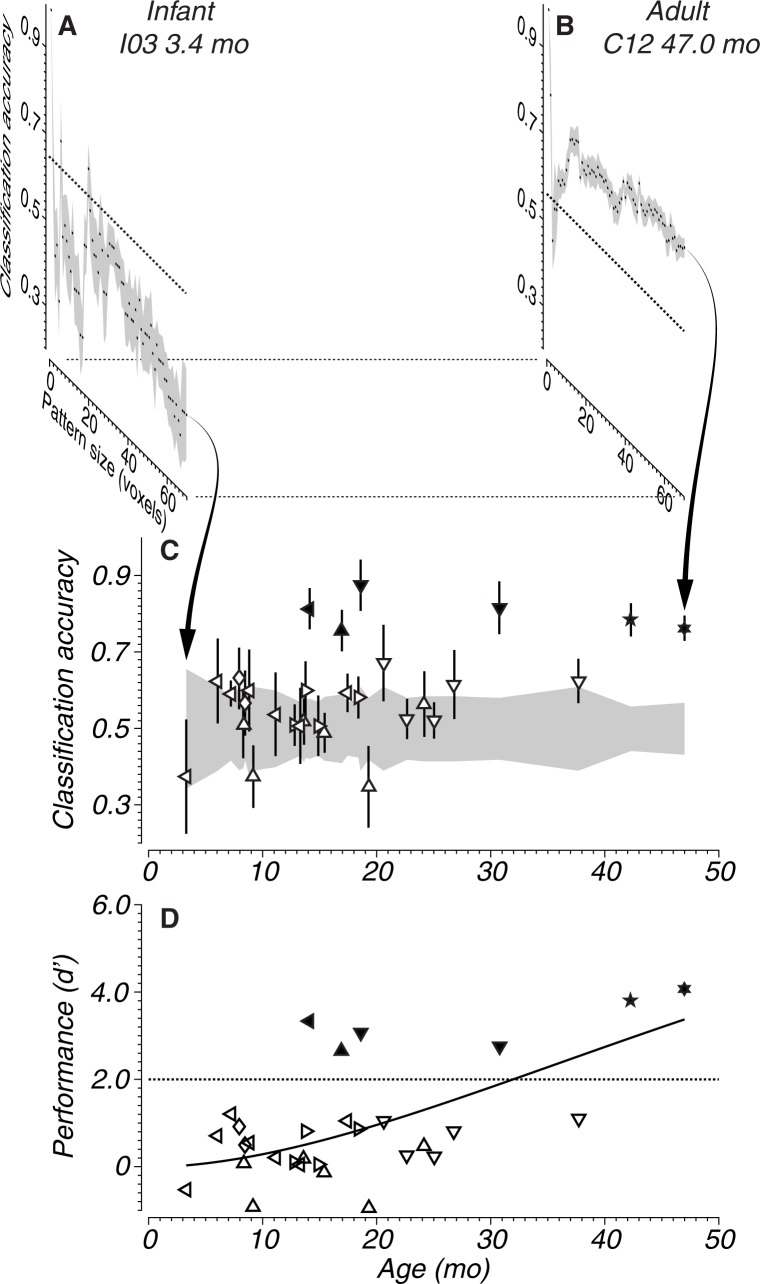
Fig 6. Results of MVPA classification of MT-V5 voxels contrasting stimulus against blank conditions.
(A,B) Classification accuracy as a function of pattern size for two subjects, one young and one adult. Squares indicate a mean of 8 cross validations. The gray shaded area is the standard error of the mean. The dotted lines are the chance threshold expected from a binomial distribution. (A) Subject I03 at 3.4 mo. (B) Same contrast shown for an adult (Subject C12 at 47 mo). (C) Classification accuracy as function of age for all subjects and sessions. The shaded area reflects chance threshold as determined by a binomial distribution. Open symbols indicate accuracies lower than threshold. Vertical lines indicate standard deviation. Each subject is indicated with a different symbol type (see lower-right panel in Fig 5 for identification). Arrows point to the classification results exemplified in the top panels A and B. (D) Transformation of classification accuracies to sensitivity index d’ (see Methods). d’ is plotted as a function of age for all subjects. The dotted line represents chance; solid and open symbols represent above chance and non-significant classifications, respectively. The solid line represents a fitted function (Naka-Rushton, Eq 2) capturing the relationship between d’ and age.

