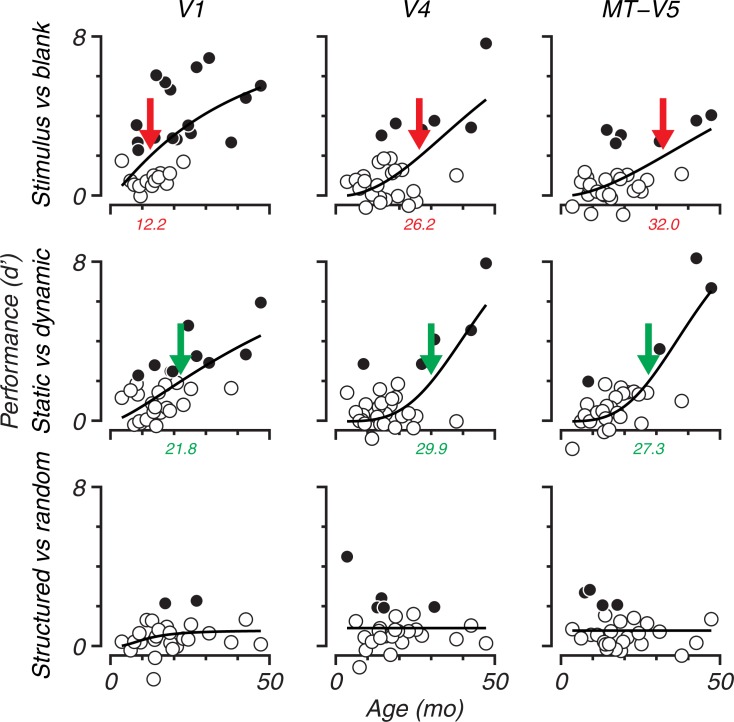
Fig 7. Development of d’ as function of age for all contrasts and areas.
Sensitivity indices are presented in the same 3 by 3 grid as in Fig 5: Contrasts are represented in rows and brain areas are represented in columns. Note that data presented in Fig 6D appear in the upper-right panel. Open symbols indicate sessions with below chance accuracies, meaning that the average accuracy (including one standard deviation) did not exceed the chance level as determined by a binomial distribution (p0.95,n). The colored arrows show the age when the fitted function (Naka-Rushton, Eq 2) exceeds d’ > 2. In the upper-right panel this corresponds to the intersection of the dotted and solid lines from Fig 6D at 32.0 mo.

