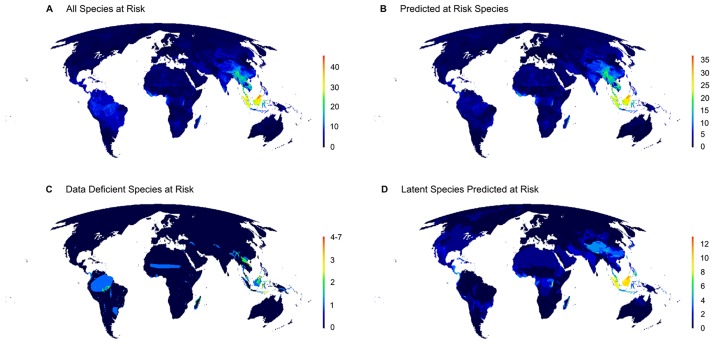
Fig 2. Geographic distribution of global mammal extinction risk.
(A) All species actually or potentially at risk (species actually assessed as threatened on the IUCN Red List, plus those predicted to be at risk). (B) All species predicted to be threatened. (C) Data Deficient species predicted to be threatened. (D) All species predicted to be at latent risk (species not currently assessed as threatened on the IUCN Red List, but predicted to be at risk of extinction by our model). Panel C is a subset of panel D, which is a subset of B, which in turn is a subset of A.

