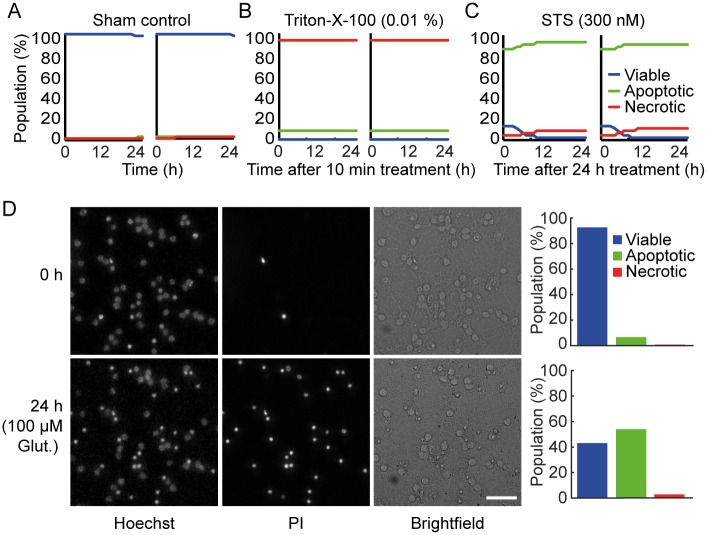
Fig 2. Classification and validation of viable, necrotic and apoptotic population in CGNs.
A) The high content screening workflow detected mostly viable cells (blue traces) when neurons were treated with control media. B) Treating wells with 0.01% Triton-x-100 for 10 min to induce necrosis prior to imaging resulted in most cells being classified as necrotic (red traces). C) Treating wells with the apoptosis inducing staurosporine (STS) at 30 nM concentration for 24 h prior to the start of image acquisition, resulted in cells primarily being classified as apoptotic (green traces). Each graph represents 9 fields of view (550–650 cells / field of view), taken from each well for 24 h with 1 h time interval between each scan. Graphs are representative of 2 independent experiments. Two individual wells are shown to demonstrate the consistency of classification across wells. D) Representative Hoechst, PI and brightfield images at 0 h and 24 h following 100 μM glutamate treatment for 10 min. Quantification of viable, apoptotic and necrotic populations in these wells (bar charts) demonstrated that neuronal cell death 24 h after transient glutamate exposure was primarily apoptotic.

