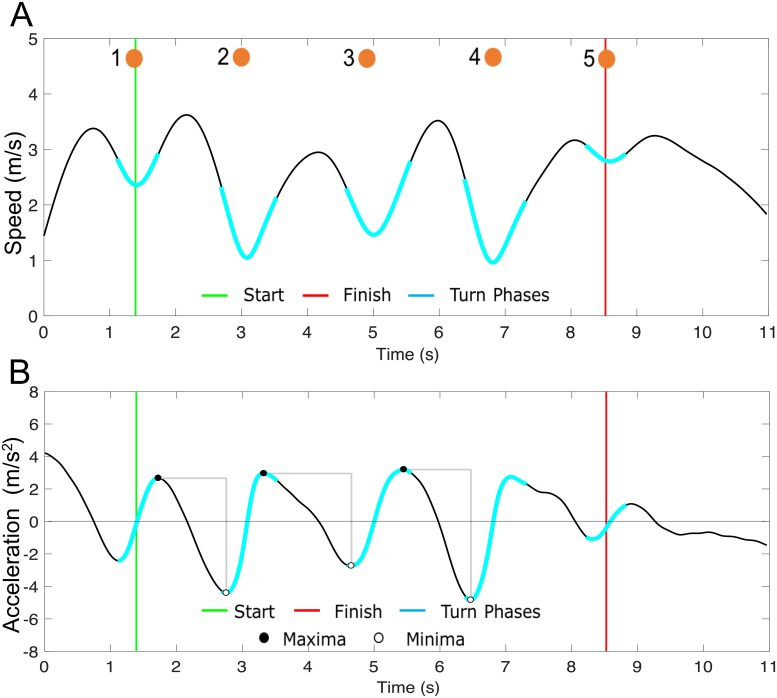
Fig 3. Exemplar body speed and tangential acceleration estimates.
(A) Body speed and (B) tangential acceleration estimates vs. time for an exemplar high performer. The approximate time that the performer circumvented each cone is represented with numbered orange circles. The tangential acceleration range is represented by the vertical gray bars between successive cones.

