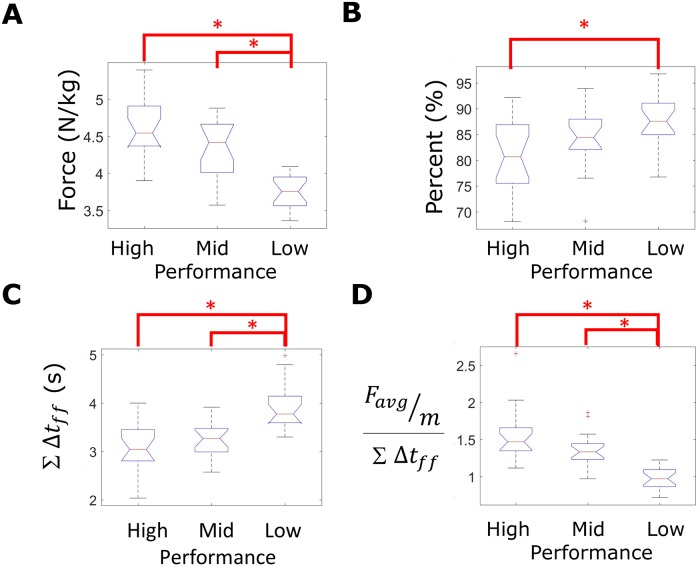
Fig 8. Turn phase ground reaction-based performance metrics grouped by agility drill time.
Boxplots of ground reaction-based performance metrics for each trial evenly grouped by sorting agility drill time as the performance outcome. The following metrics are displayed, calculated during turn phases: (A) Average horizontal ground reaction magnitude (body mass normalized), (B) average percent horizontal ground reaction normal to the foot trajectory, (C) cumulative footfall duration, and (D) “force generation” metric. Asterisks indicate statistically significant differences between performance groups via post-hoc mean rank test (Table 1).

