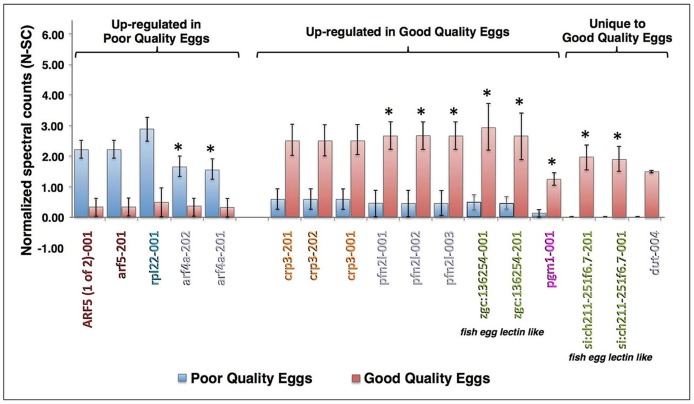
Fig 6. Proteins significantly differing in abundance between egg quality types in the Multiple Samples Experiment.
The proteins are named for the transcript(s) to which spectra were mapped; for full protein names, see S2 Table. Only proteins common to both egg quality groups with ≥4-fold difference in N-SC between groups, placing them in the top 2.3% of proteins showing such differences, or proteins unique to an egg quality group with mean N-SC values ≥0.5 and a statistically significant difference in N-SC between egg quality groups, are shown (independent samples t-test, p≤0.05 after Benjamini Hochberg correction for multiple tests). Vertical bars indicate mean N-SC values (n = 4 per egg quality type) and vertical brackets indicate SEM. Protein (transcript) labels are color-coded to indicate functional categories to which the proteins were attributed (Fig 2). Asterisks indicate proteins that were also detected and regulated in the same direction in the Pooled Samples Experiment.

