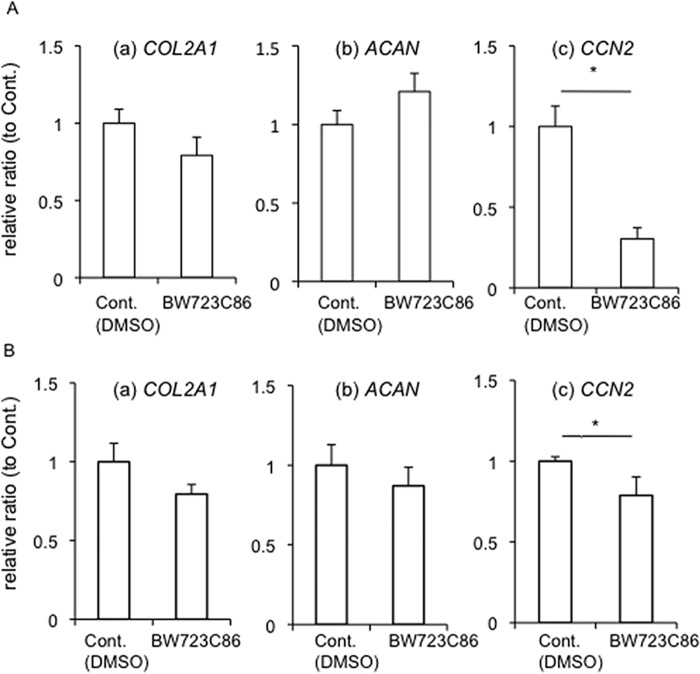
Fig 2. Real-time RT-PCR analysis of COL2A1, ACAN, and CCN2 mRNAs in HCS-2/8 cells treated with BW723C86, an agonist of 5-HT2BR.
(A) After HCS-2/8 cells had reached confluence, they were treated with BW723C86 at a concentration of 10 μM for 12 h. Then, total RNA was collected; and real-time RT-PCR analysis was performed. The amounts of these mRNAs were normalized to that amount of GAPDH mRNA. The graphs show the expression levels of (a) COL2a1, (b) ACAN, (c) CCN2 after incubation with (n = 6) or without BW723C86 (n = 6). (B) HCS-2/8 cells were treated with BW723C86 at a concentration of 10 μM for 24 h. The graphs show the expression levels of (a) COL2a1, (b) ACAN, (c) CCN2 after incubation with (n = 3) or without BW723C86 (n = 3). In all graphs, the ordinate indicates the relative ratio with respect to untreated sample (ratio = 1.0), and bars represent mean and standard deviation. The data were analyzed by Student t-test, and p < 0.05 (*) was considered significant.

