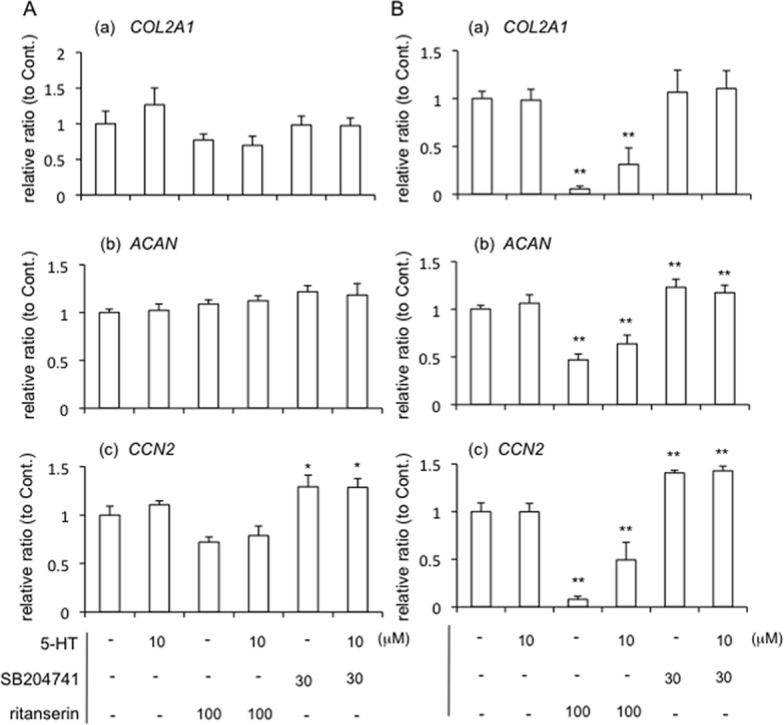
Fig 3. Real-time RT-PCR analysis of COL2A1, ACAN, and CCN2 mRNAs in HCS-2/8 cells treated with the combination of 5-HT and SB204741, an antagonist of 5-HT2BR or retanserin, an antagonist of 5-HT2AR.

(A) HCS-2/8 cells were grown until they had reached confluence. Then, the cells were treated with 5-HT (10 μM), ritanserin, an antagonist of 5-HT2AR (100 μM), SB204741, an antagonist of 5-HT2BR (30 μM) or the combination of 5-HT and SB206553 or ritanserin. After 12 h, total RNA was collected; and real-time RT-PCR analysis was then performed. The amounts of these mRNAs were normalized to that amount of GAPDH mRNA. The graphs show the expression levels of (a) COL2a1, (b) ACAN, (c) CCN2 mRNAs in HCS-2/8 cells treated with vehicle control (PBS and/or DMSO, n = 4), 5-HT (n = 4), ritanserin alone (n = 3), the combination of 5-HT and ritanserin (n = 3), SB204741 alone (n = 4), or the combination of 5-HT and SB204741 (n = 4). (B) HCS-2/8 cells were treated with 5-HT, ritanserin, SB204741, or the combination of 5-HT and SB206553 or ritanserin for 24 h. The graphs show the expression levels of (a) COL2a1, (b) ACAN, (c) CCN2 in HCS-2/8 cells treated with vehicle control (PBS and/or DMSO, n = 4), 5-HT (n = 4), ritanserin alone (n = 4), the combination of 5-HT and ritanserin (n = 4), SB204741 alone (n = 4), or the combination of 5-HT and SB204741 (n = 4). In all graphs, the ordinate indicates fold induction with respect to control sample (ratio = 1.0), and bars represent mean and standard deviation. The data were analyzed by Tukey’s test for multiple comparisons, and p < 0.05 (*), p < 0.01 (**) was considered significant.
