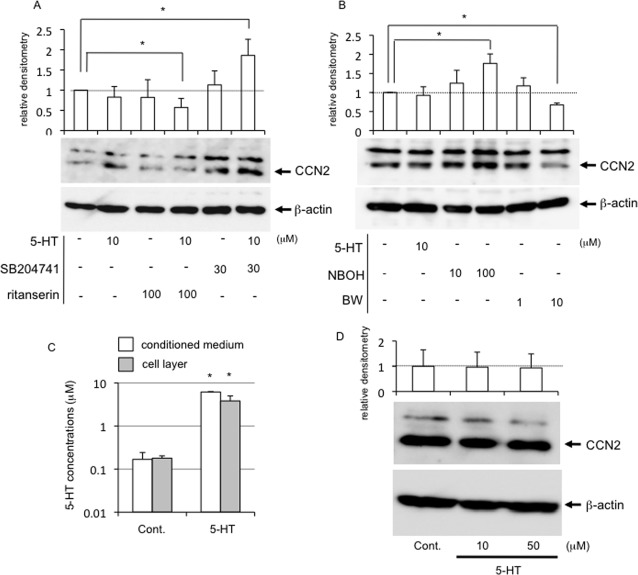
Fig 4. Protein production of CCN2 regulated by 5-HT signaling via 5-HT2AR and 5-HT2BR.
HCS-2/8 cells were grown until they had reached confluence. (A) The cells were treated with vehicle control (PBS and/or DMSO), 5-HT, ritanserin alone, the combination of 5-HT and ritanserin, SB204741 alone, or the combination of 5-HT and SB204741 at the indicated dose. Cell lysates were prepared 24 h later, and Western blot analysis was performed with anti-CCN2 and β-actin antibodies. The graph indicates relative densitometry to untreated controls (ratio = 1.0; dotted line) from 5 independent cultures and analyzed by Bonferroni’s test, and p < 0.05 (*) was considered significant. (B) HCS-2/8 cells were treated with 5-HT alone (10 μM), NBOH-2C-CN (10 μM or 100 μM) or BW723C86 (1 μM or 10 μM) for 24 h. Then cell lysates were prepared, and Western blot analysis was performed. Relative densitometry (untreated control = 1.0; dotted line) from 5 independent cultures are presented and analyzed by Bonferroni’s test, and p < 0.05 (*) was considered significant. (C) HCS-2/8 cells were treated with 5-HT at the concentration of 10 μM for 24 h, and the cell culture supernatant and cell layer fraction were harvested. Quantification of 5-HT was performed by using an ELISA system. The concentration of 5-HT produced by HCS-2/8 cells was determined by subtracting the 5-HT concentration in fresh media from that in conditioned media. Results are presented as the mean and standard deviations of 3 independent cultures and analyzed by Bonferroni’s test, and p < 0.05 (*) was considered significant. (D) HCS-2/8 cells were treated with 5-HT at the concentration of 10 and 50 μM for 24 h, and Western blot analysis was performed. The graph indicates relative densitometry to untreated controls (ratio = 1.0; dotted line) from 3 measurements and analyzed by Dunnett’s test, and there was no significant difference.

