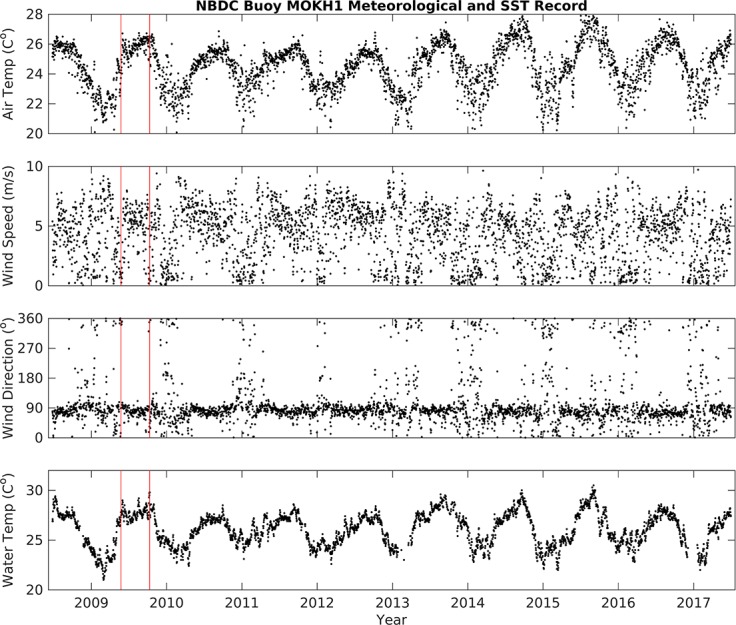
Fig 3. Time-series of air temperature, sea surface temperature, wind direction, and wind speed data from the National Buoy Data Center station ‘MOKH1’, November 20, 2008 –November 20, 2016.

Red vertical lines = approximate fish kill dates.

Red vertical lines = approximate fish kill dates.