
Fig 5. Time-series of Kāne‘ohe Bay Marine Core Base Air Station (KBMCB) data, May 2009.
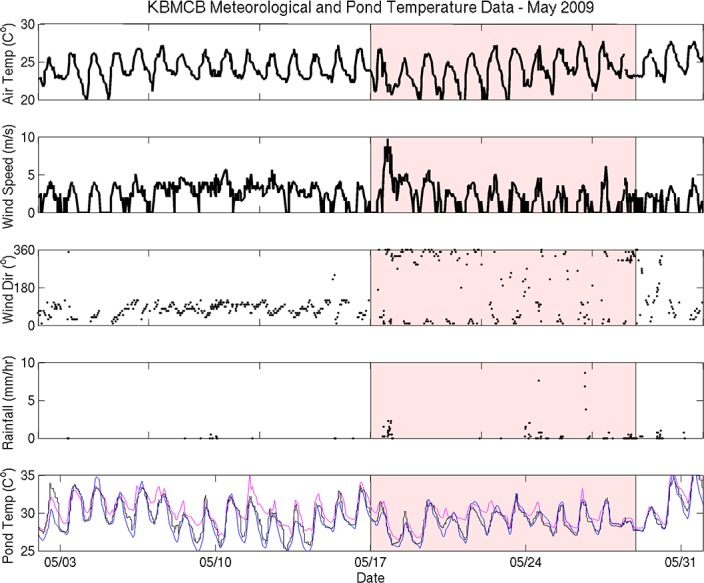
The week before the fish kill was analyzed separately (shaded red). Fishpond temperatures from each station are as follows: Stake 13 = blue, Stake 15 = black, Stake 18 = pink.