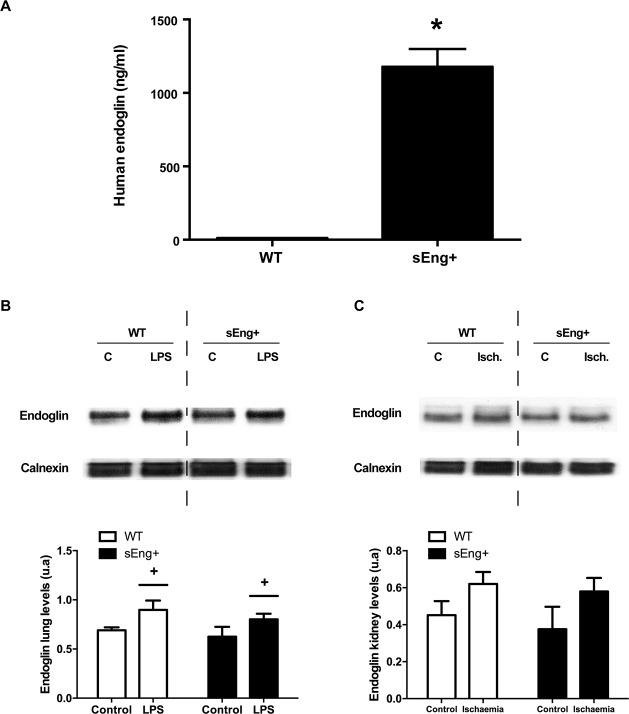
Fig 2. Soluble human endoglin and membrane mouse endoglin in WT and sEng+ mice.
(A) Soluble human endoglin was measured by ELISA from plasma of WT and sEng+ mice. Data are expressed as mean ± SEM. n = 20 in each group of mice. *p<0,001, T test. (B) Mouse membrane endoglin amount of protein in the lung was determined by western blot: +p<0,05 LPS vs control, two-way ANOVA. (C) Mouse membrane endoglin amount of protein in the kidney was determined by western blot. Equal loading of samples was confirmed by immunodetection of calnexin. Top: Representative immunoblots. Bottom: densitometric analysis. Data are expressed as mean ± SEM. n = 5 in each group of mice.

