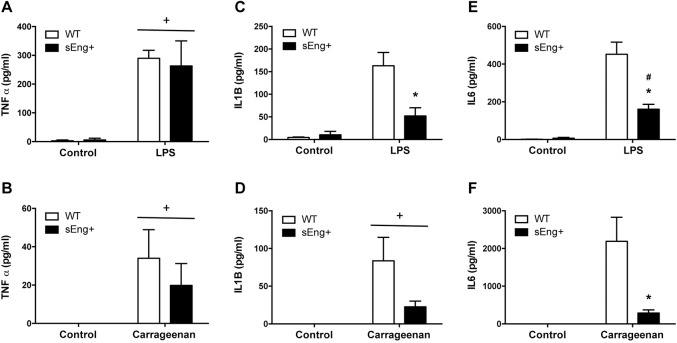
Fig 7. Inflammatory cytokines in BAL and air-pouch lavage.
Quantitative analysis of proinflammatory cytokines (TNFα, IL1β and IL6) in BAL and air pouch lavage was performed by ELISA and presented as picograms per milliliter of lavage. Data are expressed as mean ± SEM. n = 5 in each group of mice. (A) TNFα concentration in BAL, +p<0,0001 LPS vs control, two-way ANOVA; (B) TNFα concentration in air pouch lavage, +p<0,05 carrageenan vs control, two-way ANOVA; (C) IL1β concentration in BAL, *p<0,05 vs LPS WT, T test; (D) IL1β concentration in air pouch lavage, +p<0,01 carrageenan vs control, two-way ANOVA; (E) IL6 concentration in BAL, #p<0,001 vs control sEng+, T test; *p<0,05 vs LPS, T test; (F) IL6 concentration in air pouch lavage, *p<0,05 vs carrageenan WT, T test.

