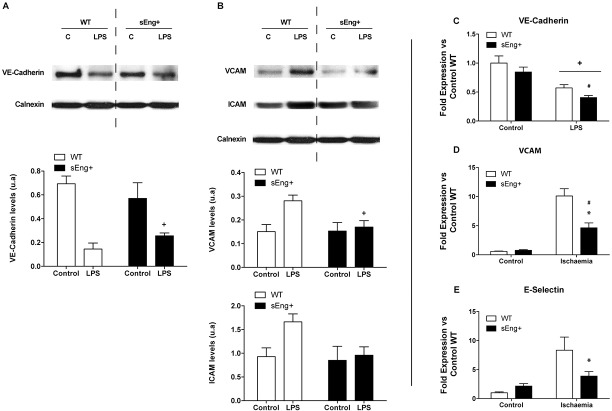
Fig 12. Effect of circulating soluble endoglin on endothelial adhesion molecules.
(A) VE-Cadherin amount of protein and mRNA expression were determined by western blot: +p<0,0001 LPS vs control, two-way ANOVA; and RT-PCR (C): +p<0,0001 LPS vs control, #p<0,05 vs control sEng+; two-way ANOVA. (B) VCAM and ICAM amount of protein was determined by western blot, +p<0,05 LPS vs control, two-way ANOVA. (D)VCAM mRNA expression was also determined by RT-PCR in kidney tissue: *p<0,01 vs ischemic WT, #p<0,005 vs control sEng+, T test. Equal loading of samples was confirmed by immunodetection of calnexin. Top: Representative immunoblots. Bottom: densitometric analysis. Data are expressed as mean ± SEM. n = 5 in each group of mice. (E) E-Selectin mRNA expression was determined by RT-PCR. E-Selectin, *p<0,05 vs ischemia WT, T test.

