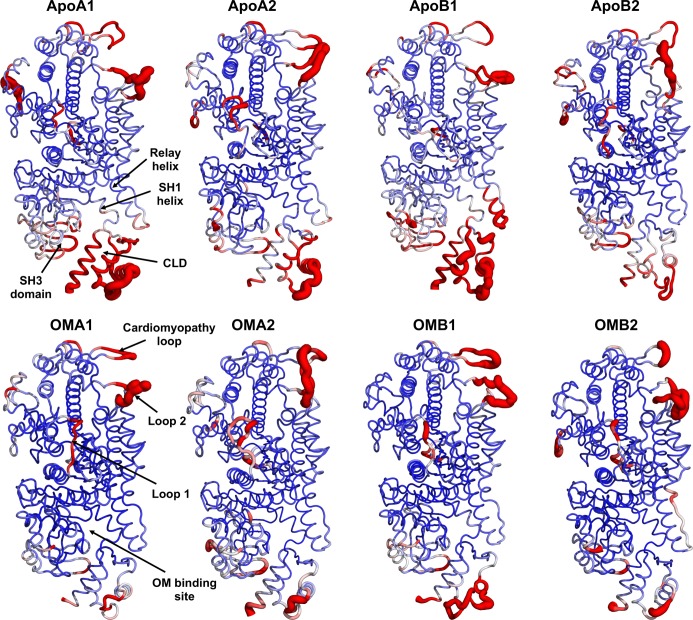
Fig 2. Mapping of Cα RMSF profiles onto the cMotorD structure.
RMSF values from Apo and OM-bound simulations are colour mapped onto the cMotorD structure from blue (0 Å) to red (3.4 Å). The average structure is used for each simulation. The thickness of the tube representation is proportional to the RMSF value. High flexibility regions and the OM binding site are also labelled.

