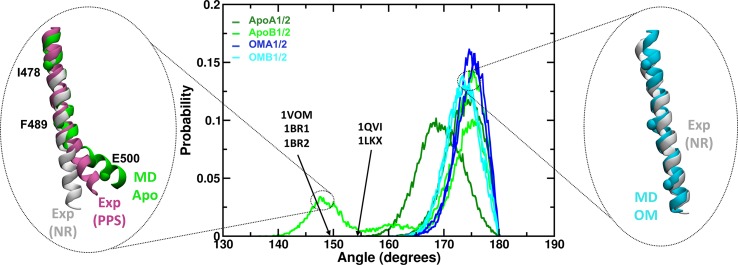
Fig 4. Bending of the relay helix during the MD simulations.
The relay helix bending was measured by calculating the angle formed by residues I478, F489 and E500 (Cα atoms only). The central plot shows the probability distribution of the angle values observed during Apo (green hues) and OM-bound (blue hues) simulations. Arrows indicate the approximate value of the angle measured for representative experimental structures of the pre-power stroke state (PDB IDs shown). Apo trajectories showed a higher propensity for bent conformations (lower angles) than OM-bound simulations. The insets show representative Apo bent (green, left) and OM-bound straight (cyan, right) structures. Experimental structures of the relay helix in the near-rigor (NR, white, PDB ID: 1SR6) and pre-power stroke (PPS, magenta, PDB ID: 1QVI) state from scallop myosin are also represented as reference.

