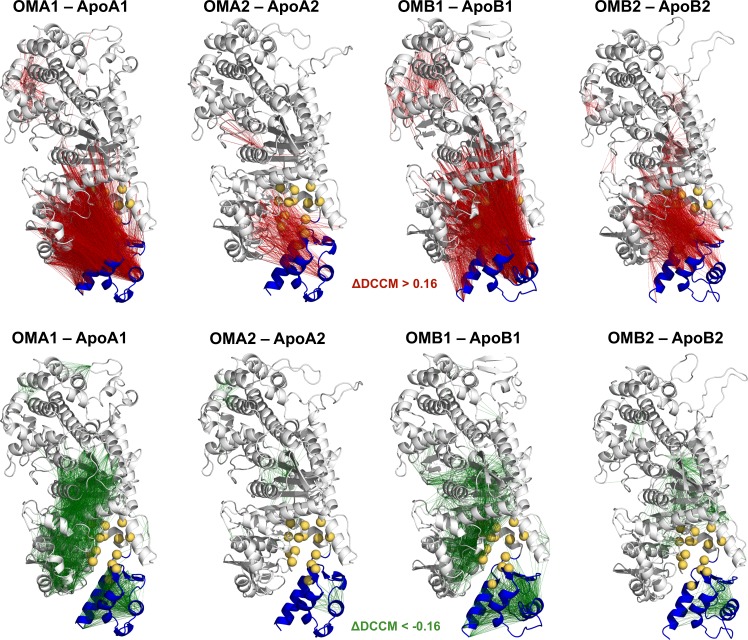
Fig 7. Comparison of dynamic cross-correlation networks.
Difference DCCM matrices (ΔDCCM) calculated between pairs of OM-bound and Apo simulations are mapped onto the initial structures of each OM-bound simulation. Edges connect residue pairs that have a positive (red) and a negative (green) ΔDCCM value, using a threshold of 0.16. Residues in the OM-binding site are represented as yellow spheres, while the CLD domain is coloured in blue.

