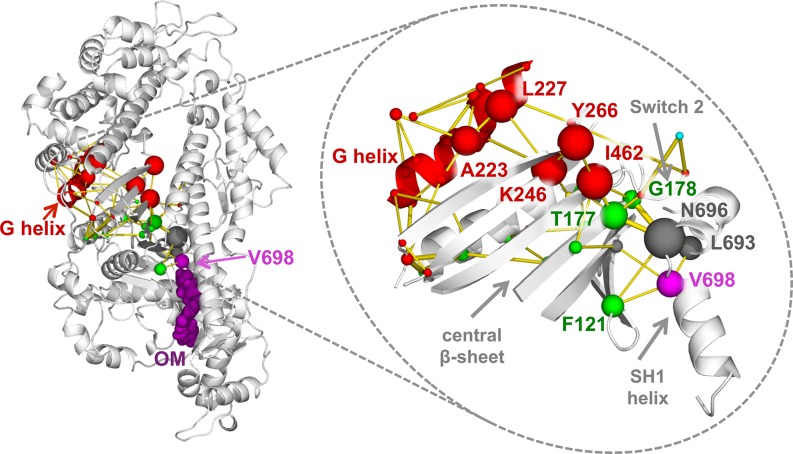
Fig 10. Pathways connecting the OM-binding site and the G-helix in the contact change network.
The shortest paths connecting V698 (magenta) and G helix residues (red) in the network of OM-Apo contact changes are represented as yellow edges. The paths are calculated from a consensus contact change matrix calculated over all the simulations. Only contacts with a change in frequency larger than 0.1 were considered. The edge thickness is proportional to the difference between OM and Apo contact frequency. For each pair of endpoints, the top 5 shortest paths are represented. The nodes in the paths are represented as spheres coloured according to the subdomain they belong to and with a radius proportional to the number of paths going through them. The top 10 residues for number of paths are also labelled.

