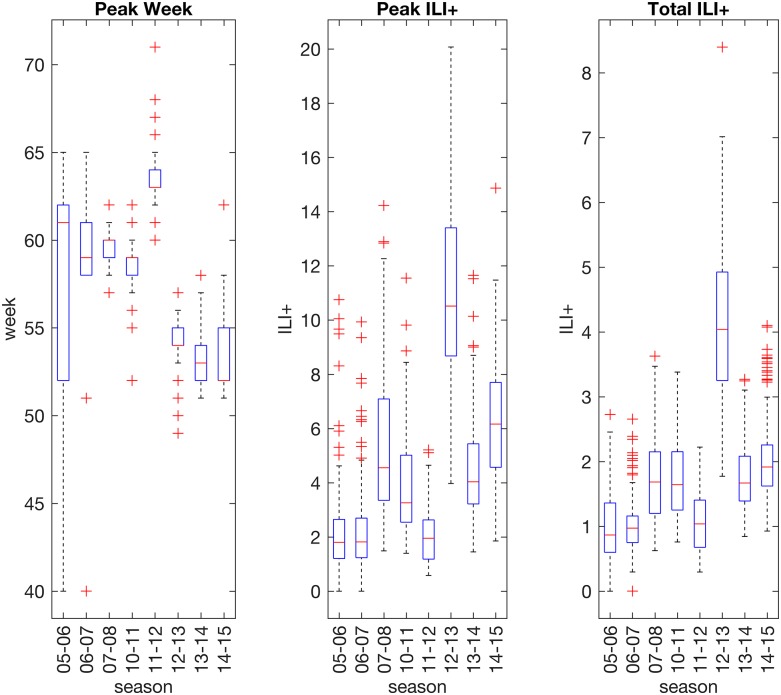
Fig 1. Distributions of observed outbreak peak timing, peak ILI+ and total ILI+ by season.
Boxplots show the range of metric values observed each season across 97 cities and 48 states. ILI+ measures the number of influenza positive patients per 100 visits to outpatient visits to health care providers.

