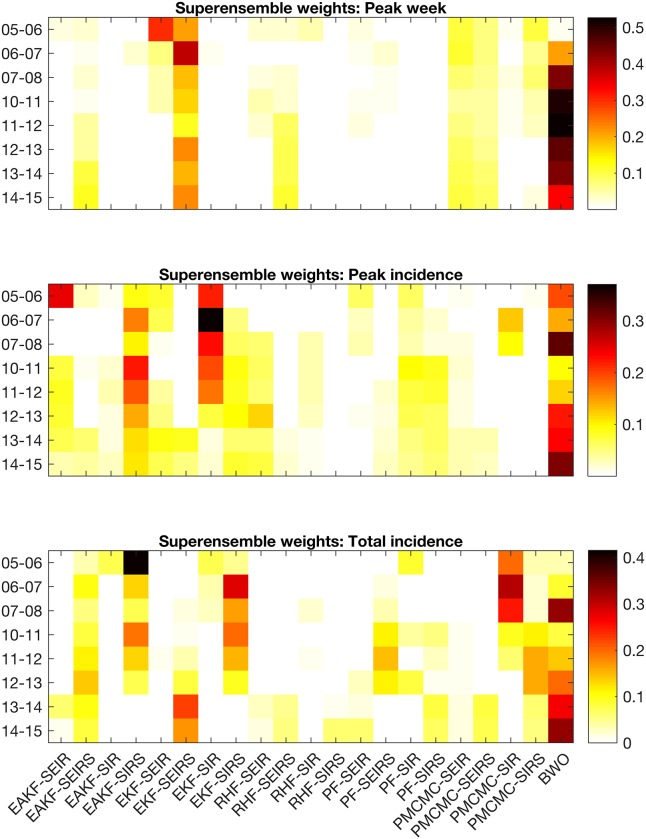
Fig 4. Contribution of each individual forecast to the baseline superensemble forecast for peak week (top), peak incidence (middle), and total incidence (bottom) by year.
The colors indicate the weight assigned to an individual forecast system specified by the horizontal axes and the influenza season specified by the vertical axes. For example, the upper-right square in each subplot shows the weight assigned to the EAKF-SEIR forecast system for the 2005–2006 influenza season.

