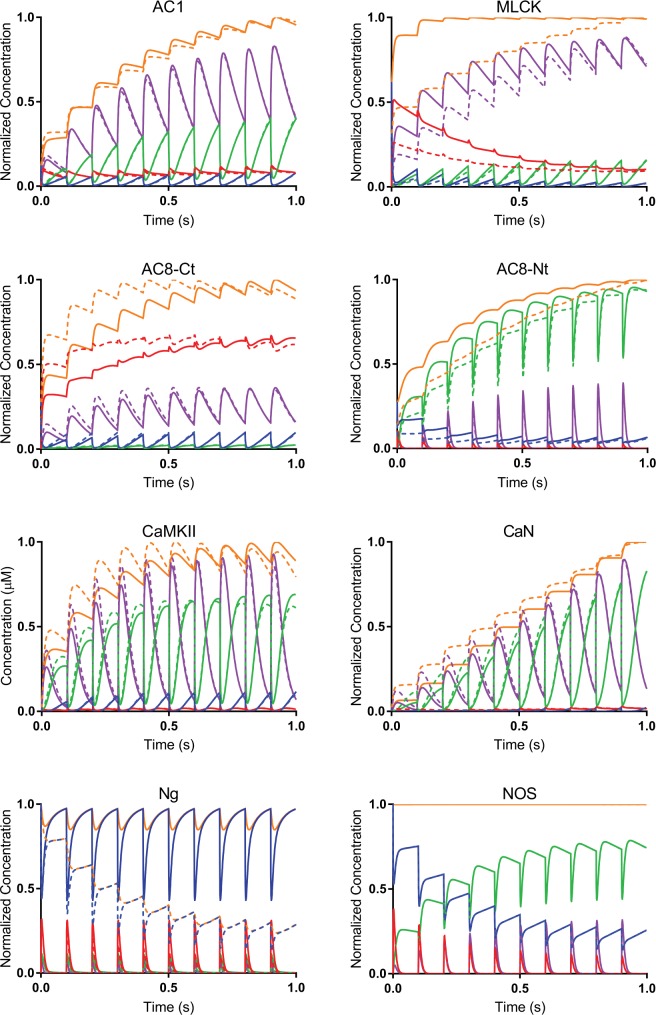
Fig 3. Competition for CaM alters binding dynamics.
Time-course of CaM binding partners bound to various states of CaM for 1 second of 10 Hz Ca2+ flux: CaM0 (blue), CaM2N (red), CaM2C (green), CaM4 (purple), and CaMtot (orange). CaMtot is the sum of all CaM-bound states for a given protein. The concentration of each species is normalized against its maximum value of CaMtot. Solid lines denote the isolated model. Dotted lines denote the competitive model. The differences between isolated and competitive behavior are more significant for some CaM binding partners than others.

