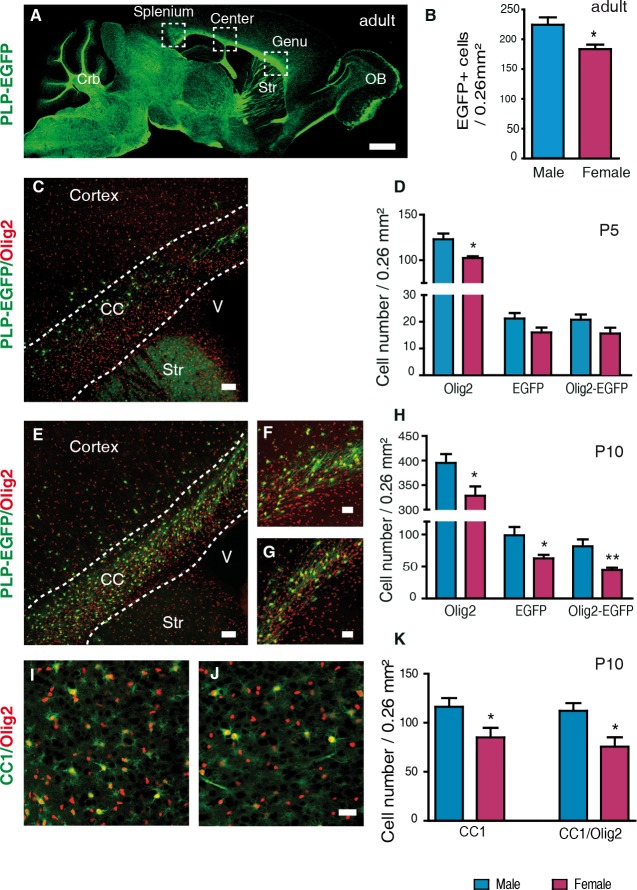
Fig 1. The density of oligodendroglial cells becomes sexually differentiated between P5 and P10.
(A) Sagittal section showing EGFP expression in the adult PLP-EGFP mouse brain. White matter tracts display intense green fluorescence, including the three subregions of the corpus callosum: genu, center and splenium. Crb = cerebellum; OB = olfactory bulb; Str = striatum.(B) Comparison of the densities of EGFP+ oligodendroglial cells in corpus callosum (CC) between adult male and female PLP-EGFP mice (n = 5). (C) Immunostaining of Olig2+ gliogenic progenitors (red) and EGFP+ oligodendroglial cells (green) on a sagittal brain section of a PLP-EGFP male mouse at P5. CC = corpus callosum; Str = striatum; V = third ventricle. (D) Comparison of the densities of Olig2+, EGFP+ and Olig2+/EGFP+ double-positive cells in corpus callosum between P5 male and female PLP-EGFP mice (n = 5). Immunostaining of Olig2+ cells (red) and EGFP+ cells (green) on sagittal brain sections at P10 of (E and F) a male and (G) a female. CC = corpus callosum; Str = striatum; V = third ventricle. (H) Comparison of the densities of Olig2+, EGFP+ and Olig2+/EGFP+ double-positive cells in corpus callosum between P10 males and females PLP-EGFP mice (n = 9). (I and J) Immunostaining of Olig2+ cells (red) and CC1+ mature oligodendrocytes (green) on sagittal corpus callosum sections at P10 of (I) a male and (J) a female C57Bl/6 mouse. (K) Comparison of the densities of CC1+ oligodendrocytes and CC1+/Olig2+ double-positive cells in corpus callosum at P10 between males and females (n = 5). Cell densities are presented as means ± SEM. Significance was calculated using two-tailed Student’s t test (**p < 0.01; *p < 0.05 when compared to the corresponding male group). Scale bars: (A) 1 mm; (C and E) 50 μm; (F-J) 20 μm.

