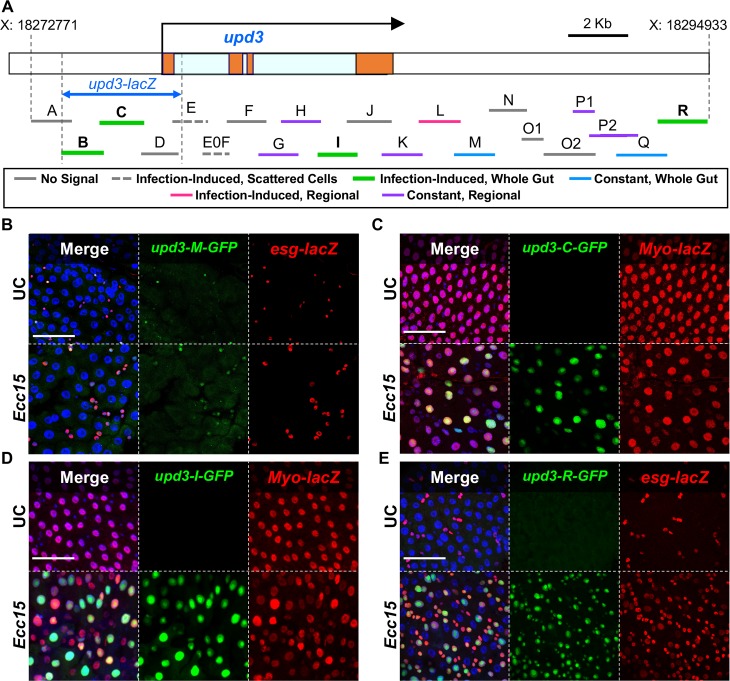
Fig 1. The upd3 gene is regulated by cell-specific, region-specific and infection-responsive enhancers.
(A) Schematic of the upd3 gene and the 21 overlapping sequences used to create GFP reporter lines. The upd3 exons are represented by orange blocks and the introns are light blue. Putative enhancer regions have been color coded by their ability to drive GFP expression as follows: Solid Grey–no midgut signal, Dashed Grey–infection induced signal in scattered cells, Green–infection-induced signal throughout the gut, Blue–constant signal throughout the gut, Pink–infection induced signal in a specific midgut region, Purple–constant signal confined to a specific midgut region. (B) Enhancer region M drives an unvarying GFP signal in esg-lacZ expressing cells (ISCs and EBs) in all regions. (C, D) Both the C and I enhancer region sequences drive GFP in an infection-inducible manner, specifically in Myo-positive cells (ECs) throughout the midgut. (E) Enhancer region R drives infection-induced GFP expression in esg-positive cells (ISCs and EBs). (B, C, D, E) Confocal microscopy images taken at 40x magnification with four color channels. DAPI stained nuclei in Blue, GFP in green and antibody stained β-Gal in red. Scale bars are 50μm.

