
Figure 6.
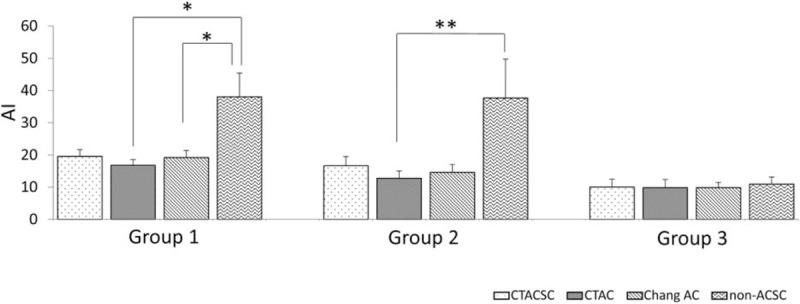
Comparison of AI. AIs were calculated for different I-123 FP-CIT SPECT images reconstructed methods, are shown by disease group. ∗P < .01; ∗∗P < .05 by Freedman test. AI = asymmetry index, FP-CIT = N-ω-fluoropropyl-2β-carbomethoxy-3β-(4-I-123 iodophenyl)nortropane, SPECT = single-photon emission computed tomography.