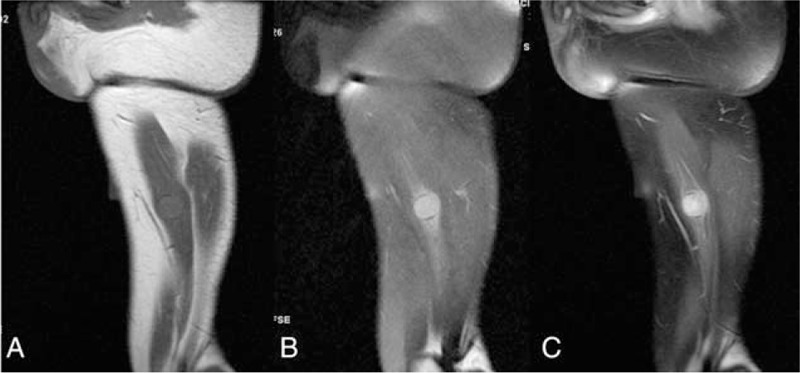
Figure 3.

Magnetic resonance imaging (MRI) of the nodule in the right adductor magnus. (A) T1WI showed the homointensity of the nodule in the right adductor magnus. (B) T2WI showed the moderately high intensity. (C) Contrasted-MRI showed a homogeneous enhancement.
